

He sees you when you’re sleeping. He knows when you’re awake …
![]()
![]()
![]()
![]()
![]()
![]()
![]()
![]()
![]()
![]()
![]()
![]()
![]()
Overview
This describes a) automation script installed from GitHub that installs b) Docker images c) within AWS EC2, Azure, and Google Cloud d) a sample app e) put under stress by JMeter/Gatling while being analyzed by f) Dynatrace.
STATUS: IN PROGRESS
What’s different with this introduction to Dynatrace is I provide a step-by-logical-step hands-on approach to dive deep into the technology and its vendor. This is so you’re not stumbling around wasting time on high-level sales pitches. Commentaries here are given “just-in-time” after you do each step.
Acronyms used here
ADK = Application Development Kit
APM = Application Performance Monitoring (the market Dynatrace is in)
AppMon = Application Performance
SLA = Service Level Agreements
Visit = a group of transactions performed by the same user over a defined time period.
UEM = User Experience Management (product offering)
PureModel = PurePath + PureStack
- PurePath traces requests horizontally across processes end-to-end tracing at the code-level
- PureStack dives into the vertical infrastructure tiers
Mind Map
Dyntrace offers this “MindMap” PDF of the subject matter tested by their Professional-level certification (there is also a less comprehensive one for the Associate level exam).
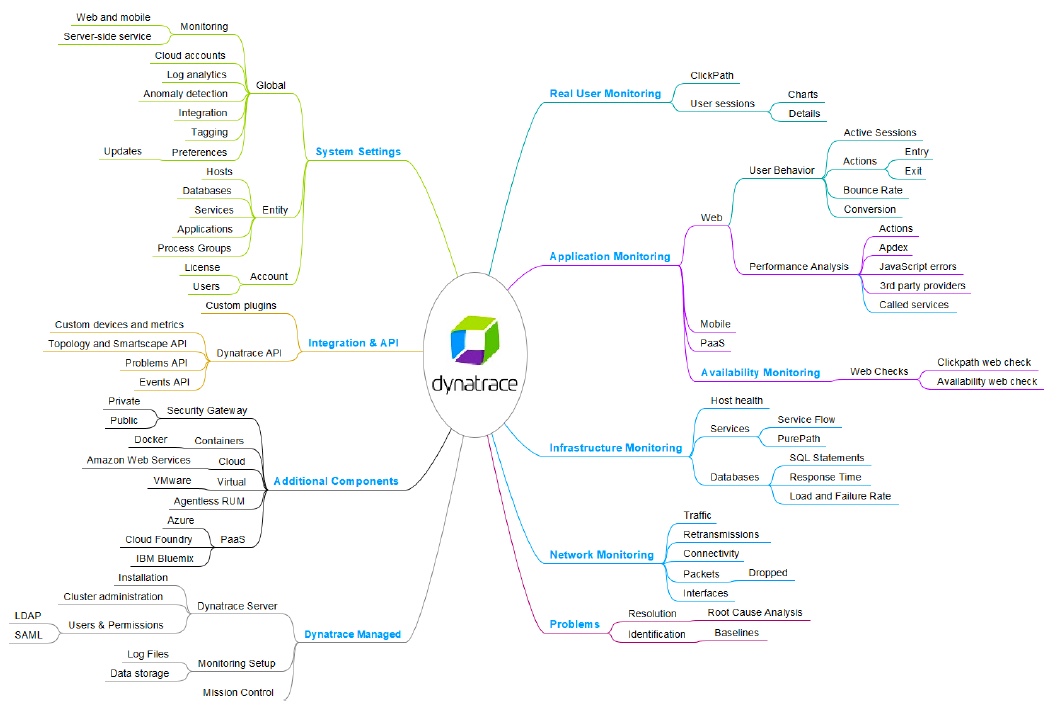
The major “arteries” are the types of monitoring:
- Real User Monitoring (RUM)
- Application Monitoring
- Availability Monitoring
- Infrastructure Monitoring
- Network Monitoring
-
Additional components
- Dynatrace Managed (server & monitoring setup)
- System Settings (Global, Entity, Account)
- Integration and API
- Problems
Product Offerings
Dynatrace AppMon Personal & UEM ???
Two Dynatrace products have downloads:
- Application Monitoring rich client AppMon
- Data Center RUM (Real User Monitor) captures traffic and analyzes it
SaaS = Software as a Service:
- Application Monitoring Appmon web
- Synthetic Monitoring has fake users logging in, etc.
- Dynatrace adds HTTP header
- Keynote monitors what end-users experience through the public network
- Dynatrace Load
- Business Service Management
Product Editions
There are different editions of Dynatrace for the Development Team, Test Center, and Production:
 (Click to pop up larger image)
The product that enables “Shift-Left” is one that enables identification of performance issues during development.
Competitors
- Splunk has been around the longest to process logs
- AppDynamics, built on top of the open-source Lucene engine for search
- ElasticSearch (Elastic stack)
- DataDog
- Logz.io
- etc.
Notes:
- http://blog.takipi.com/splunk-vs-elk-the-log-management-tools-decision-making-guide/
- Dynatrace does not directly compete with OverOps, which analyzes Java and .NET source code.
Dashboards
The bottom line with APM is its dashboards, which display data collected in clever ways. The Dynatrace dashboard for User Experience and Satisfaction presents a lot of data, but in a clean and clear way:

Circles around around face icons represent relative percentages. Green is good. Red is bad.
Competitors’ dashboards would present a world map in one pane, response time in another, etc.
Metrics displayed can focus on specific periods of time:

Visualizations of metrics on response time, failures rate, HTTP errors, CPU, Throughput, Network traffic, Retransmissions, Connectivity, etc. are automatically baselined as the basis for detecting anomalies.
- memory leaks
- CPU hotspots
- n+1 problem - when client makes many more API calls to server.
- SQL statements - Too many, slow.
Dynatrace is following the industry trend of moving to the cloud:
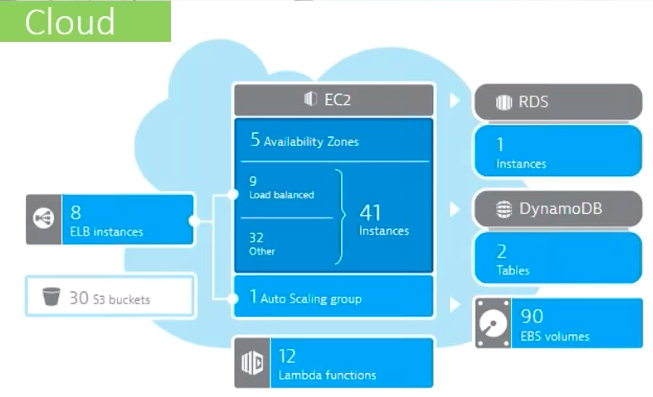
See https://github.com/Dynatrace/AWSMonitoringTutorials
OneAgent for whole stack

Dynatrace collects data from servers through an installed agent program, called “OneAgent” because one program collects data for all aspects in the stack:
- Applications
- Services
- Processes
- Hosts
- Containers
- Data centers
A map of all entitities are shown together in the “Smartscape” view.
All this enables Dynatrace to recognize when changes have occured, and take appropriate action.
Full-stack discovery
Tracing is in the “Dynatrace” name and Dynatrace has continued innovation in providing end-to-end tracing of transactions through the technical stack. When a token is added in the HTTP header at the client, Dynatrace tracks it through the web server and database.
So Dynatrace is able to display where response time contribution within application transactions:

The transaction names above are from Dynatrace’s own sample “Easy Travel” (monolithic app) instantiated within AWS using Beanstalk, ECS container services and Sprint Boot app*
In recent years, Dynatace added AI-powered Analytics to discover root cause and full stack resource discovery has led to self-healing at scale. See:
- https://help.dynatrace.com/intelligent-problem-detection/
- https://help.dynatrace.com/intelligent-problem-detection/prediction/prediction/
Traditionally, products such as Splunk analyzed logs emitted from servers. Dynatrace does that too.
Provisioning
Docker, VMWare, EC2, Azure, CloudFoundry
Scripts: Chef, Puppet, Ansible, PowerShell
Overprovisioned?
Free lifetime local license
During the 30-day free trial period, install up to 5 distributed servers (in the cloud).
After the 30-day trial period, install only on local machines.
The following focusing on analysis of server applications running locally on your laptop.
QUESTION: Is there a package to Homebrew for Mac and Chocolatey for Windows?
-
Register for download at:
https://bit.ly/dtpersonal (https://www.dynatrace.com/en/products/dynatrace-personal-license.html)
PROTIP: My Gmail address was accepted in the “Business email” field.
-
Confirm email subject “Please confirm your Dynatrace Trial account”.
NOTE: The public face of Dynatrace is Andreas Grabner (@grabnerandi, agrabner@dynatrace.com, https://github.com/grabnerandi
The US address of Dynatrace is 404 Wyman Street, Suite 500, Waltham, MA 02451
Dynatrace also has offices in Detroit, Michigan, Linz, Austria, and Gdańsk, Poland.
-
Click Register and Start Trial.
WARNING: You can’t get back to this page again?
-
Get the license from email “Your Dynatrace trial license” file such as this, created on 2017 March 16:
dynaTrace_license_201703161023.key
PROTIP: Each agent installer is pre-configured to where the agent sends its information.
NOTE: The video mentioned in the email (https://www.youtube.com/watch?v=2ycuNlYUl9E) What is Dynatrace AppMon and How to Get Started – January 2016
-
PROTIP: Run a Dockerized image in a server (in a cloud) because that’s how production will work. And it won’t muck up your local machine’s settings and disk space.
http://dynatrace.github.io/Dynatrace-Docker
https://github.com/Dynatrace/Dynatrace-Docker
NOTE: The Github home for Dynatrace is:
-
If you want to do it the hard way and install locally, click the operating system icon to download installer.
OS File Ver. Size Mac dynatrace-full-darwin-x86.jar 6.5 995.8 MB Windows dynatrace- 6.5 995.8 MB PROTIP: If you want to keep installers, find out the version and add it to the file name. You would need to keep installers for vetting by corporate Security.
Security-conscious enterprises have their people download from a vetted repository such as an internal Artifactory or Nexus rather than direct download because changes by the vendor (or someone pretending to be them) can have security problems.
- Use Mac Archiver utility to extract the jar file to file dynatrace-full-darwin-x86.jar.cpgz.
- dynatrace-full-darwin-x86.jar.cpgz.
Get Certified
https://university.dynatrace.com/certificate/industry
Dynatrace Certification website lists a learning path.
The “Industry Associate” level validates understanding of APM was retired April 1, 2018.
The exam is done on your desktop computer, not at a testing center.
- Enter your profile info (time zone, phone, picture ID, etc.) at https://prod.examity.com/Dynatrace/Student/MyProfile.aspx
- Write down your answers to security questions.
- Do a computer check at https://prod.examity.com/systemcheck/ComputerReadinessCheck.aspx
- Get a promotion code if that is part of your organization’s deal with Dynatrace. Or get a code by paying $200 at ?
-
Schedule exam at https://prod.examity.com/dynatrace/Student/ScheduleAnExam.aspx Sechedule can be next day.
The DOWNLOAD: Associate Exam Blueprint.pdf Answer 80% correct 70 multiple choice items in 2 hours. It’s free.
The Pro written exam is $200 plus $250 for the practical exam.
Master-level.
API “FireAndIce”
See http://anapioficeandfire.com/Documentation#library-graphql
https://www.youtube.com/watch?v=O0SQL8DJxaI Online Perf Clinic – Shift-Left Performance with Spring Boot Microservices, Jenkins and Dynatrace
For infrastructure monitoring:
Use the “Add Tier” wizard.
On Apache, IIS: -agentpath:PATH/dtagent.dll=name=MyAppTier,server=collector1
Desktop
-
Use within IntelliJ IDE
Without changing a line of code get 100% end-to-end code-level performance visibility: Browser, Web-, App- and (No)SQL Activity
See every SQL Statement, Exception, Log message and HTTP Request detail
Crash Dump Analysis
https://github.com/Dynatrace/superdump (Not A replacement for in-depth analysis tools such as WinDbg.)
can be triggered via web-frontend (HTTP-upload) or via REST-API.
ADK
To send dynatrace tags
- Native Applications and Custom Protocols with Dynatrace AppMon ADK recorded November 9, 2016.
Data management
-
What is a Purelytics [2:51] for custom analytics on ELK stack

-
PureLytics Stream and UEM Heatmap [59]
https://github.com/Dynatrace/Dynatrace-Elasticsearch-Plugin plugin for AppMon to fetch measures from an Elasticsearch Cluster
-
https://help.dynatrace.com/api-documentation/v1/timeseries/
To view data in ES within Splunk:
- https://github.com/hvandenb/splunk-elasticsearch
- https://answers.splunk.com/answers/372999/is-there-anyway-to-push-data-from-elasticsearch-or.html
Videos
YouTube playlists:
-
Classic AppMon: http://bit.ly/dttutorials
-
Dynatrace Fullstack: http://bit.ly/oneagenttutorials
Dynatrace University Self-Learning portal at http://university.dynatrace.com
https://www.youtube.com/watch?v=wExU-AQ0ydk&index=1&list=PLqt2rd0eew1bmDn54E2_M2uvbhm_WxY_6
- https://www.youtube.com/watch?v=O0SQL8DJxaI
http://bit.ly/dttutorials (https://www.youtube.com/playlist?list=PLqt2rd0eew1bmDn54E2_M2uvbhm_WxY_6)
Mainly high-level stuff with a few technical points:
- What is Application Monitoring
- Selecting a Dynatrace Edition [3:17] Docker containers
- Reviewing the Architecture the Application Monitoring Platform, PureModel, and PureStack.
- Exploring Agent Development Kits
- Exploring Core Technologies</a>
- What is a PureStack
- What is a Pure Path
- What is UEM (User Experience Monitoring) agents traps user actions for Dynatrace Collector servers to store and evaluate.
- Understanding Components
- Exploring the Web Interface
- Planning the Deployment
- Installing Application Monitoring on Windows [9:51] v6.1.0 admin / admin
- Deploying Dynatrace Collectors
- Managing Sensors
- Managing Dynatrace Servers
- Managing System Profiles
- Working with Support - Part 2
- Managing Licenses
- Managing Memory Analysis
- Managing On Premises SaaS
In AWS
You can use Dynatrace in place of or in addition to Amazon CloudWatch logging. Here are the steps:
-
Download the installer from Dynatrace.com.
BLAH: I wish Dynatrace have its own on S3.
This can be either/both a Windows or Linux instance.
-
Put the Dynatrace installer in an S3 instance so that Ansible scripts to build up a server have a stable reference.
-
Create a new AWS instance.
Again, this can be either a Windows or Linux instance.
-
Install the Dynatrace agent on the server.
-
Connect the agents to the Dynatrace controller so you see metrics being recorded.
-
Impose some artificial load on the machine to see metrics in their full glory.
-
Repeat the above in an automated script:
- Jankins invoked when a commit occurs to a branch on GitHub
- The Jenkins v2 Pipeline Groovy script downloads build script from GitHub
- The build downloads installers to assemble
- The build script creates image in DockerHub
- Instantiate AWS with Docker image
- Sends an email when the image is ready for use
- Start a performance testing run
- Sends SMS texts with the results of test run
- If all is well, commits into the next branch in GitHub
Internals
Protocol is protobuf
https://community.dynatrace.com/community/display/DOCDT65/Test+Automation+Explained
https://www.infoq.com/articles/Diagnose-Microservice-Performance-Anti-Patterns
https://www.infoq.com/articles/Diagnosing-Common-Java-Database-Performance-Hotspots
Interact with people
-
Forums:
https://community.dynatrace.com/community/display/DL/Downloads
-
Listen to podcasts:
-
Ask a question of pre-sales:
-
Register and attend live webinars at:
https://bit.ly/onlineperfclinic (https://community.dynatrace.com/community/pages/viewpage.action?pageId=178101202) also on YouTube.
-
View past webinars
-
Ways to meet other users:
https://community.dynatrace.com/community/display/DL/Downloads
-
Join and attend Meetups:
-
Subscribe, then meet people at the annual conference each Feburary in Vegas:
-
Have Dynatrace salespeople look at your Purepath file:
https://bit.ly/sharepurepath (https://community.dynatrace.com/community/display/EVAL/Share+your+PurePath)
CAUTION: Many enterprises are fearful of releasing data outside the corporate firewall. Check with your Security people before sending the file out.
-
LinkedIn Groups
https://www.linkedin.com/groups/1868499/profile
Dynatrace APM User Group -
Twitter
- @Dynatrace
- @grabnerandi (Andreas Grabner, Developer Evangelist)
- #perform2019
- #dynatracer
- #apm
-
GitHub source repositories:
https://github.com/dynatrace-innovationlab
More on cloud
This is one of a series on cloud computing:
- Dockerize apps
- Kubernetes container engine
- Hashicorp Vault and Consul for keeping secrets
- Hashicorp Terraform
- Ansible server configuration automation
- Serverless software app development
- Terraform (declarative IaC)
- Build load-balanced servers in AWS EC2
- AWS On-boarding (CLI install)
- AWS MacOS instances in the cloud)
- AWS Certifications
- AWS IAM admin.
- AWS Data Tools
- AWS Security
- AWS VPC Networking
- AWS X-Ray tracing
- AWS server deployment options
- AWS Lambda
- AWS Cloud Formation/cloud-formation/)
- AWS Lightsail
- AWS Deeplens AI
- AWS Load Balanced Servers using CloudFormation
-
Microtrader (sample microservices CI/CD to production Docker within AWS)
-
AWS Data Processing: Databases, Big Data, Data Warehouse, Data Lakehouse
- Google Cloud Platform
-
Bash Windows using Microsoft’s WSL (Windows Subsystem for Linux)
- Azure cloud introduction
- Azure Cloud Onramp (Subscriptions, Portal GUI, CLI)
- Azure Cloud Powershell
- PowerShell GitHub API programming
- PowerShell DSC (Desired State Configuration)
- PowerShell Modules
- Microsoft AI in Azure cloud
- Azure cloud DevOps
- Azure Networking
- Azure Storage
- Azure Compute
- Dynatrace cloud monitoring
- Digital Ocean
- Cloud Foundry