

Tips and tricks to display metrics in dashboards that are easy to understand actionable
![]()
![]()
![]()
![]()
![]()
![]()
![]()
![]()
![]()
![]()
![]()
![]()
![]()
Overview
This article are my notes about Grafana, marketed at Grafana.com, with documentation at https://grafana.com/docs/grafana/latest
NOTE: Content here are my personal opinions, and not intended to represent any employer (past or present). “PROTIP:” here highlight information I haven’t seen elsewhere on the internet because it is hard-won, little-know but significant facts based on my personal research and experience.
We use a series of dashboard views that are related to each other, to make data easy to understand and actionable.
-
The Overview view provides a high-level view of the status of the entire system, showing a few
Status summary colors and shapes
The main or first view summarizes the status of key metrics important to the user: totals and averages:
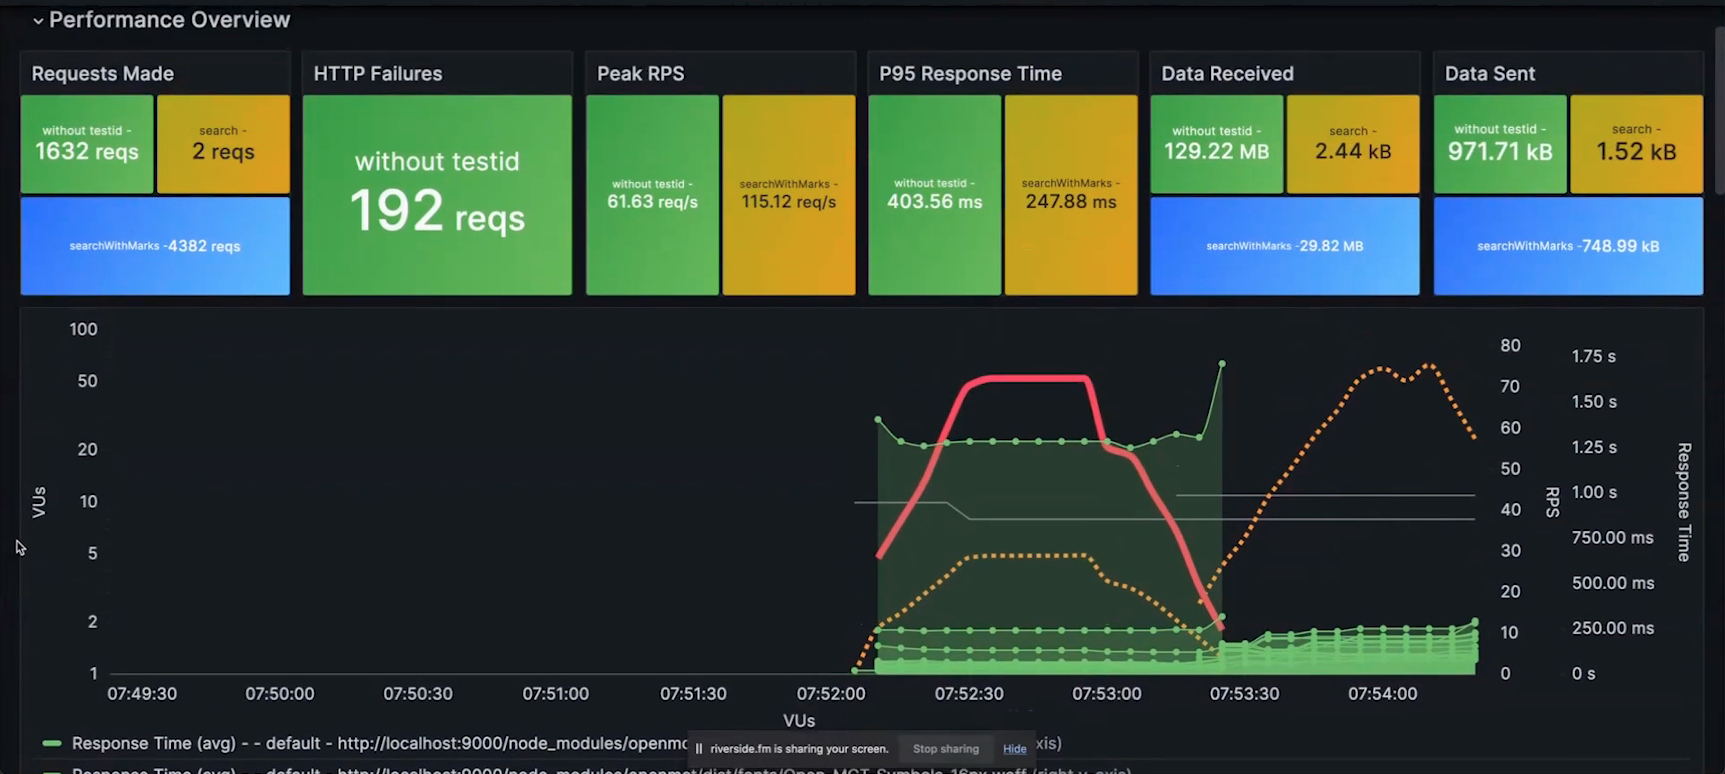
PROTIP: An improvement on the view above is to make use of colors of different shades and shapes to indicate the status (rather than using colors simply divide items):
- CIRCLE = OK = medium bluish green to accommodate those with red-green color blindness
- DIAMOND = WARNING = light yellow
- SQUARE = CRITICAL = dark red
Use a accessible color palette that accommodates those with different types of CVD (Color Vision Deficiency) (aka Color Blindness):
- website by Paul Tol has a Color Schemes document.
PROTIP: Each number should be clickable to drill down to the next level of detail.
-
Clickable
Click each number to drill down to the next level of detail.
-
Comparison lines in trend lines
Trend Line Graphs
The line graph at the lower-right uses solid and dashed lines to indicate different aspects tracked:
- Solid lines
- Dotted lines
- Dashed lines
This example uses a “bulb” to illustrate higher or lower values than anticipated:
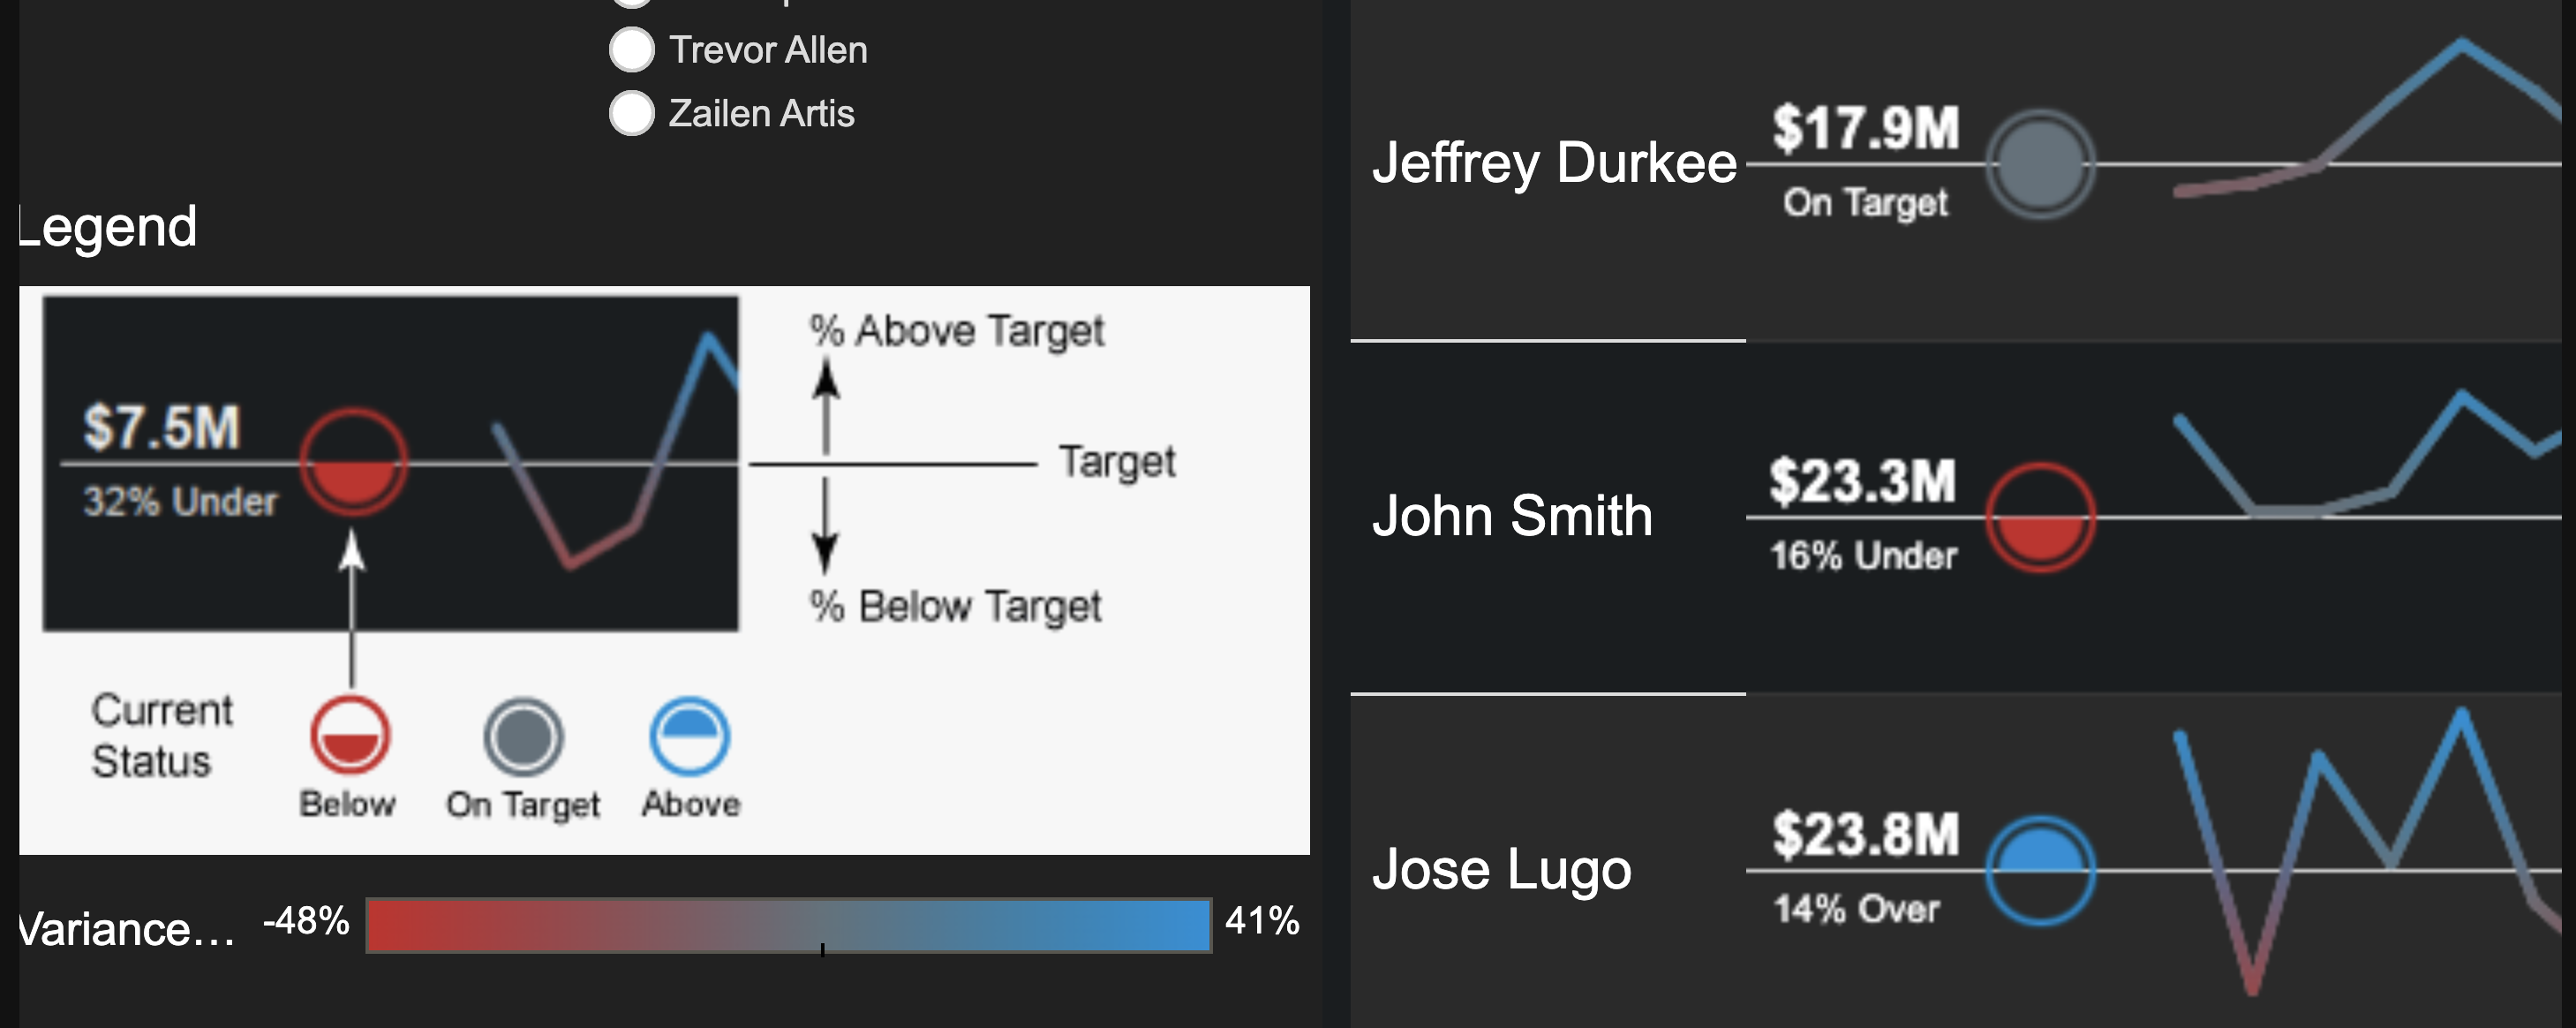
The guidance above is how I improve this dashboard view:
-
Comparisons over time
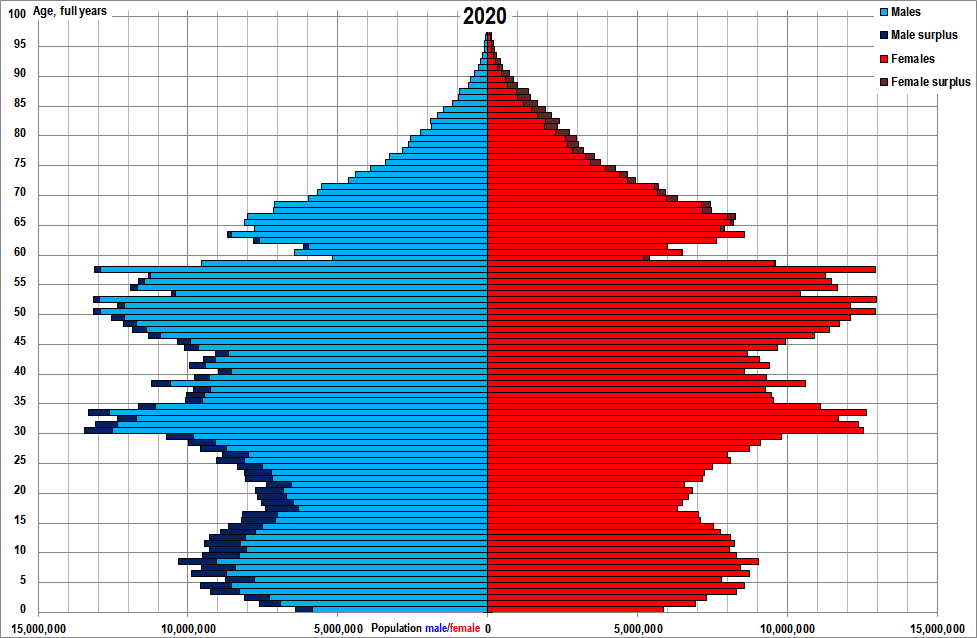
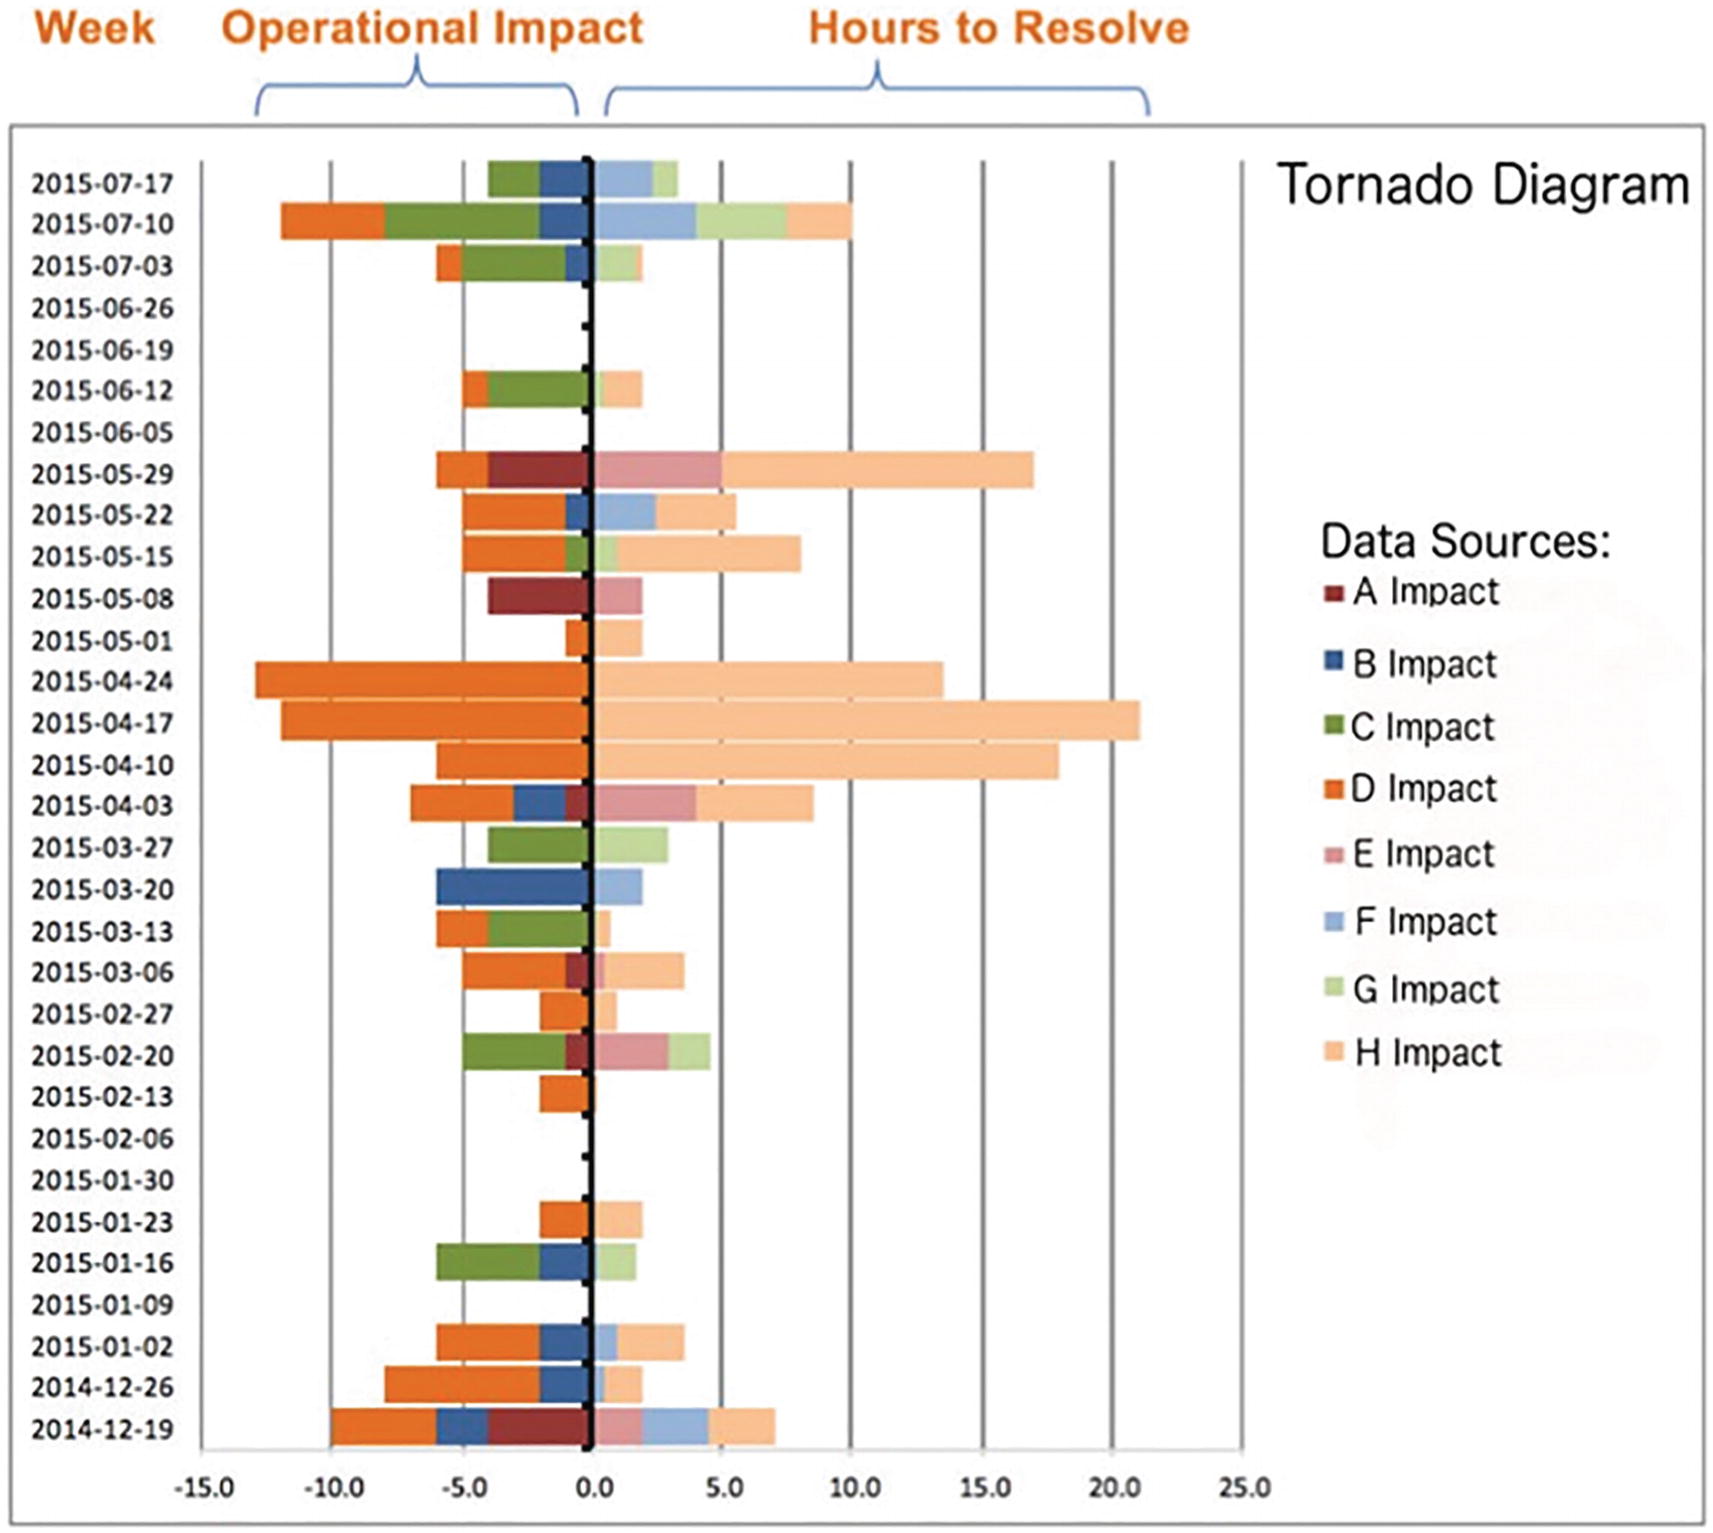
Tornado (Butterfly) Charts
Tornado or “Butterfly” charts are a special type of Bar Chart.
They are commonly used to show imbalances in populations. Age is on the vertical scale, with males on one side and females on another side. Below is a Tornado chart of China’s population in 2020:
It’s essential to have that darker shade to highlight surpluses in each row versus the opposite sex. The narrowing at the top is expected as people age, with women outliving males. Indentations are the result of lives lost during wars and other catastrophic events. China’s one-child policy began with people at 58 years old in 2020.
Instead of males and females, the two variables in the chart below are Impact on the left and Effort (Hours to Resolve) on the right, with a breakdown by categories within each bar:
Note there is no interaction between multiple variables on such a chart.
DataKitchen is also used to create these charts.
-
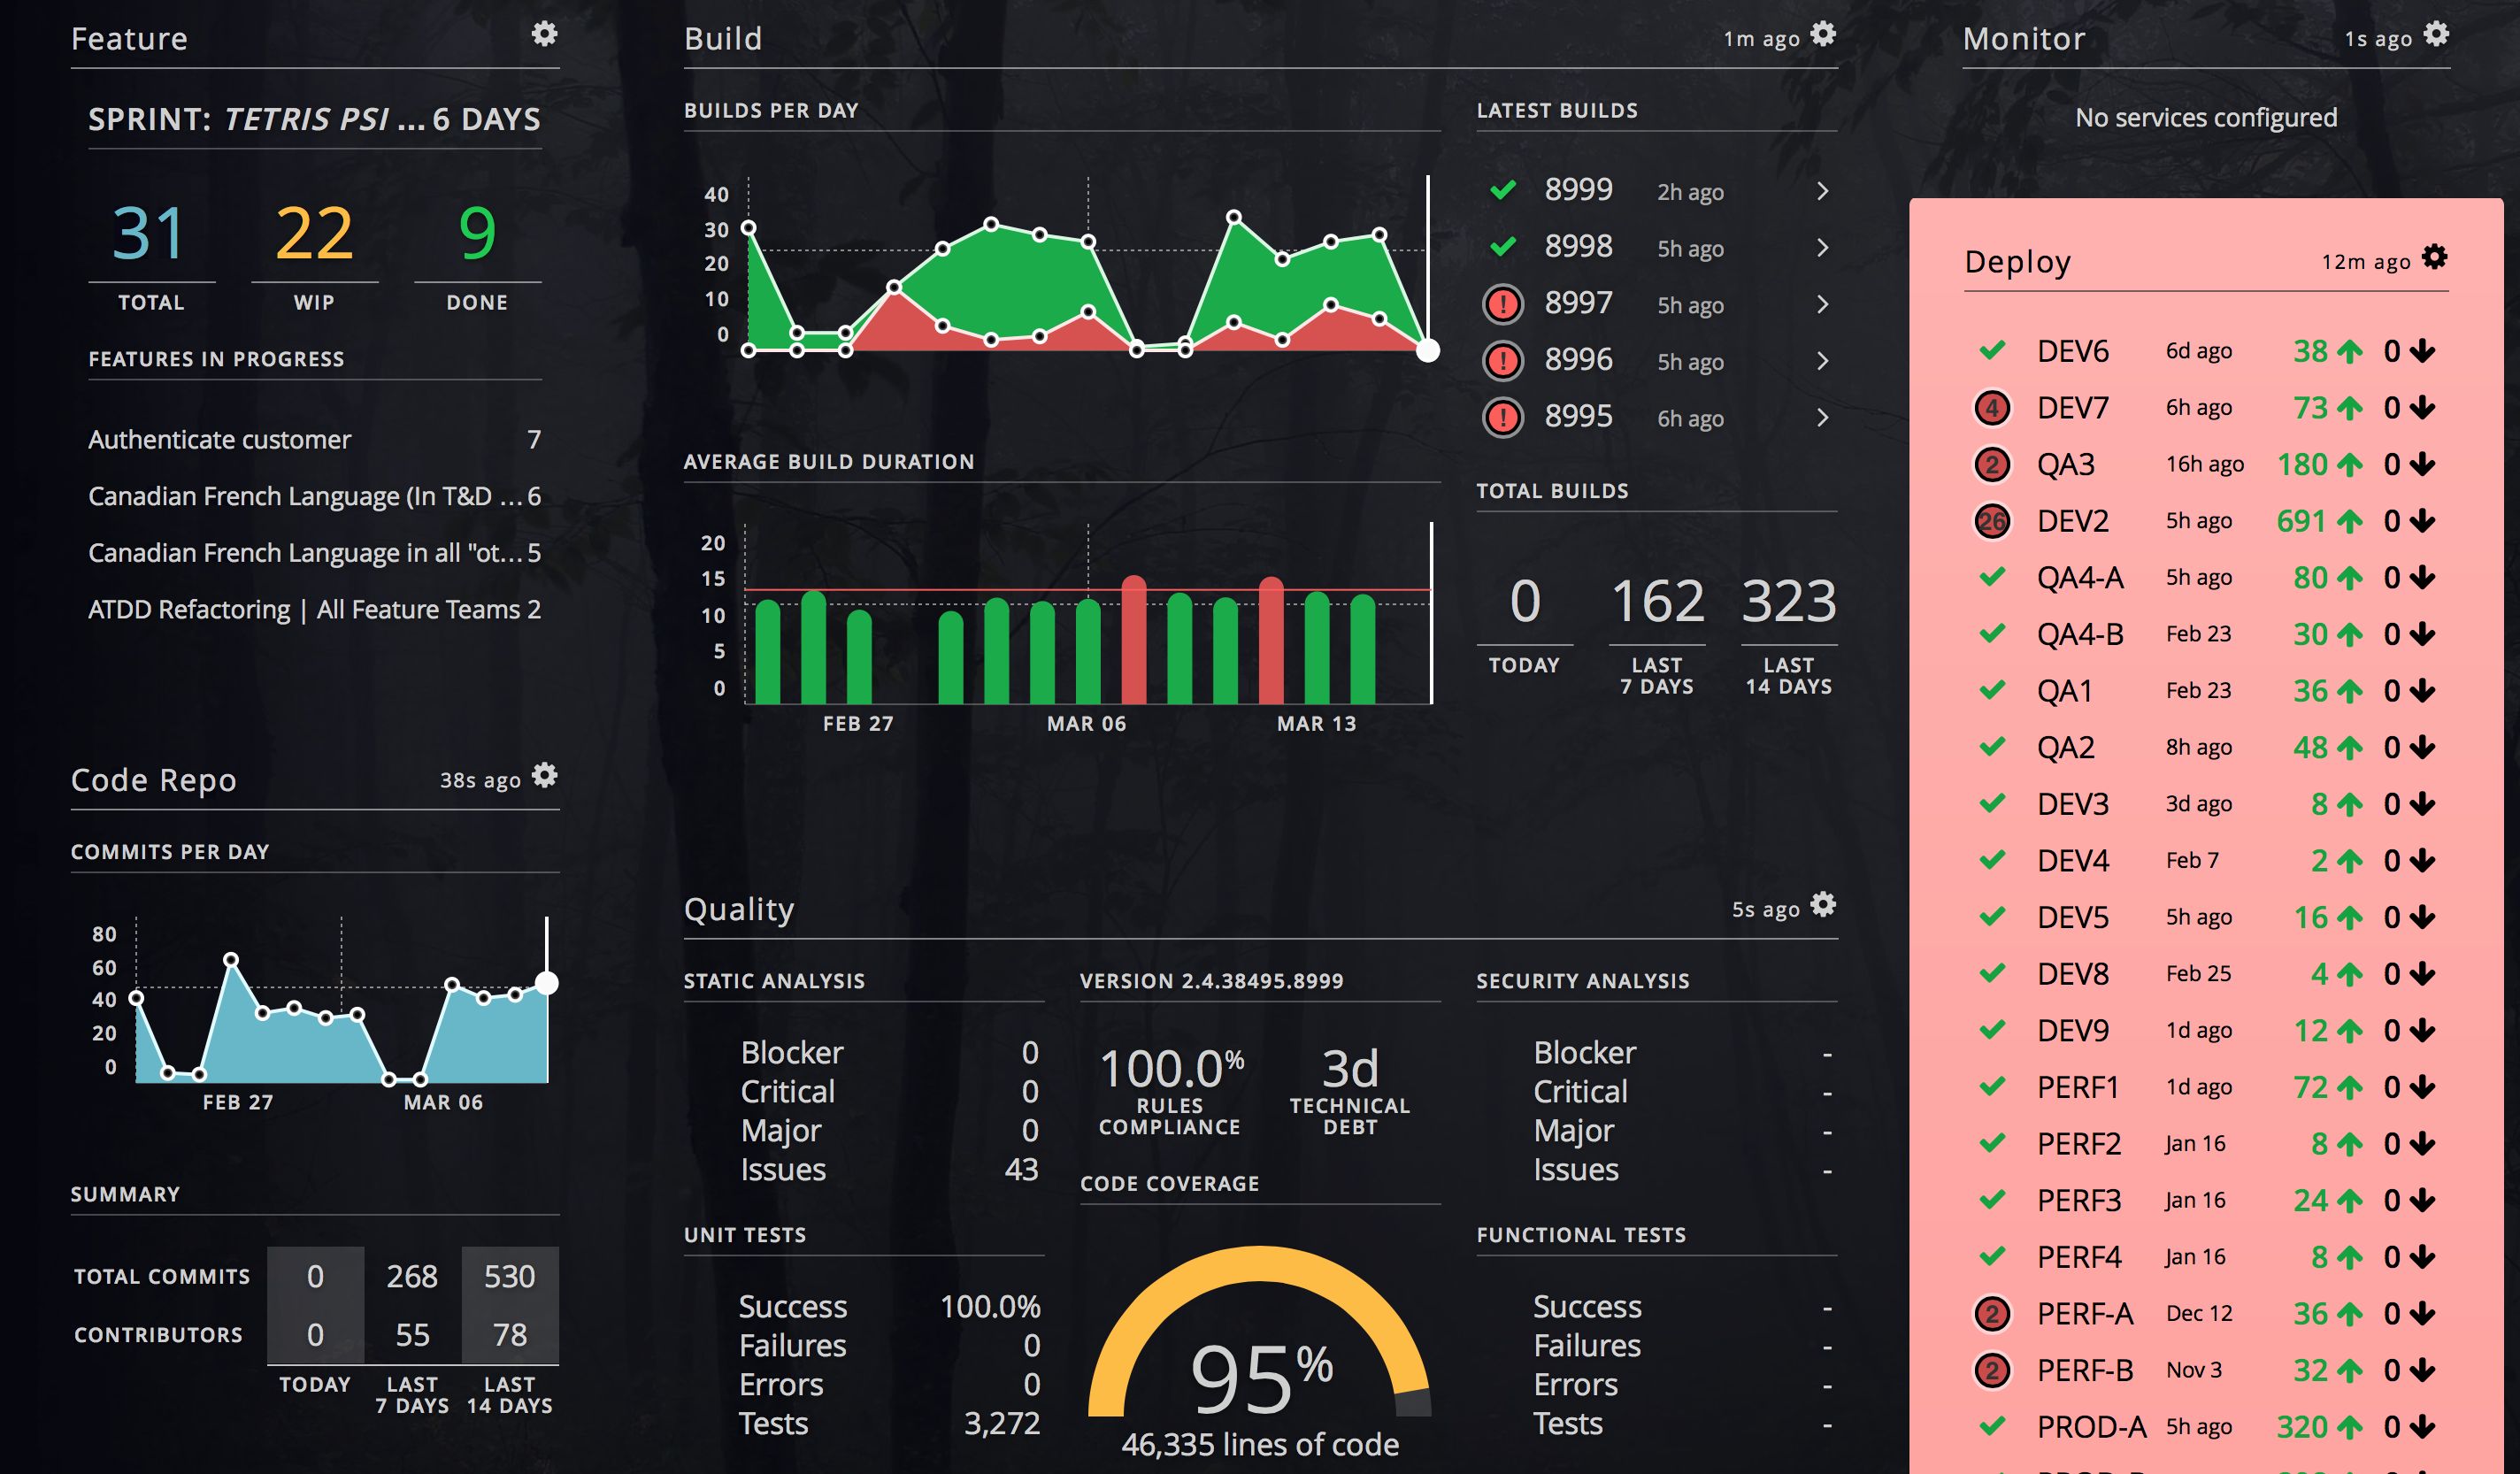
Activity dashboard:
Hygieia DevOps Dashboard
This article provides a list of dashboard tools.

Cycle Time

Outliers 90th percentile
PROTIP: To improve the above view, also show outliers at the 90th and 95th percentile.
Activity
devops-dashboards: Hygieia (from Capital One) has been a popular way to visualize the level of activity processing CI/CD DevOps runs.
Flowcharts
Some general principles:
- Generally, flows go from left to right. For example,
- data flowing from clients on the left to back-end servers on the right
- the left-most column is the most recent time period, and the right-most column is the oldest time period.
Weather maps
Yahoo Weather uses an elegant, award-winning design with icons:
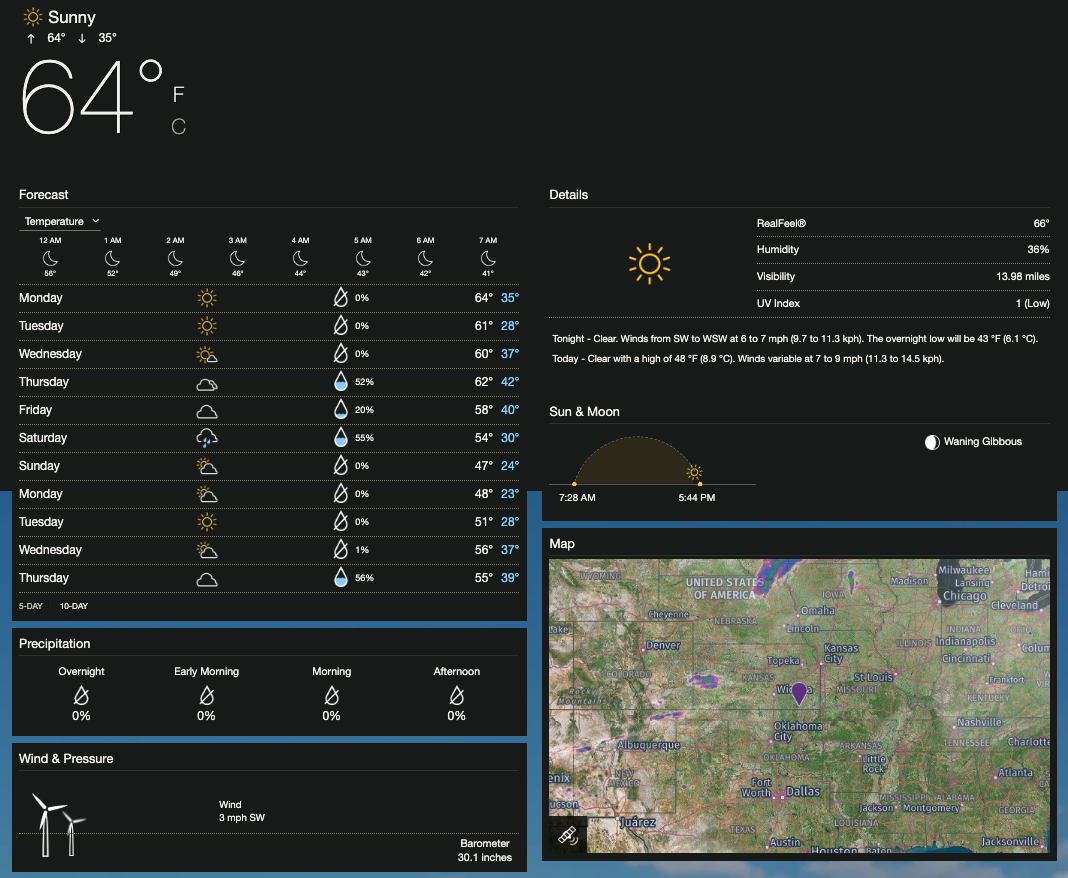
See their iPhone/iPad app
Resources
https://dribbble.com/search/dashboard Thousands of dashboard designs