

All the stats that fits on a dashboard to monitor DevOps activity
![]()
![]()
![]()
![]()
![]()
![]()
![]()
![]()
![]()
![]()
![]()
![]()
![]()
Overview
There are several approaches to providing visibility of workflow to DevSecOps, to display dashboard the various statistics of a software delivery pipeline.
Organizations can make use of general-purpose visualization tools
There are also purpose-built dashboard software. Hygieia (pronouced hi-GEE-ya), open-sourced by Capital One (the credit card company) is named after the daughter of the Greek god of medicine and personification of hygiene and prevention of illness.
Team Dashboard Widget View
Each team has its own “tactical” dashboard to present detailed information real-time:

Hygeia provides visual and quick access to detailed process data collected from several sources, so team members don’t have to keep several tabs open:
-
“Build” from individual projects in Jenkins, Bamboo, Hudson, TeamCity, udeploy, xldeploy, Cucumber CI tools
-
“Feature” shows features and items in projects within JIRA, versionone.
-
“Code repo” (commits per day) of a specific branch of a single repo collected from within GitHub, Subversion, BitBucket, GitLab
-
“Quality” shows code coverage and number of defects found in code scans done by SonarQube
-
“Monitor” shows deployments to servers. Red and green dots represent whether the server is up or down
-
Version numbers in a Maven build specification file
-
“Nexus artifacts” from the binary repository
Additional collectors specified in docker-compose.yml include artifactory, appdynamics. Emmett?
PROTIP: Again, this visibility should not used for those outside the team to meddle with questions such as “why is this particular one 15”?
QUESTION: Does the dashboard cover these 16 gates in the pipeline (10 Commandments in octal):
DOES16 San Francisco - DevOps at Capital One: Focusing on Pipeline and Measurement IT Revolution by Topol Pal, (Director, Engineering Fellow, Capital One)
- Source code version control
- Optimum branching strategy [Git and GitHub or GitLab, etc.]
- Static analysis [SonarQube]
- Code coverage
- Vulnerability scan
- Open source scan [Black Duck]
- Artifact version control [Nexus or Artifactory]
- Auto provision
- Immutable servers
- Integration testing
- Performance testing
- Build, Deploy, Testing automated for every commit
- Automated Change Order
- Zero downtime release
Program-level Pipeline Dashboard

Added since version 2 is statistical analysis for trends of health and speed. One row for each team (such as “Tetris” in the example).
PROTIP: I recommend against a competitive comparison of numbers achieved by each team because that encourages unintended consequences such as increase in hidden quality issues and technical debt. Each team has different challenges.
Hygieia limits itself to just these environments:
commit > build > DEV > QA > INT > PERF > PROD
Higher Order Metrics
PROTIP: Consider using metrics that reveal “higher order” calculations that can be use to predict future health and be used as the basis for recommendations.
- Elapsed response time as a function of load?

Was this pattern of performance predicted from testing?
-
Network latency separate from server response time by having monitoring clients near the server.
-
Difference in response time before and after a change.

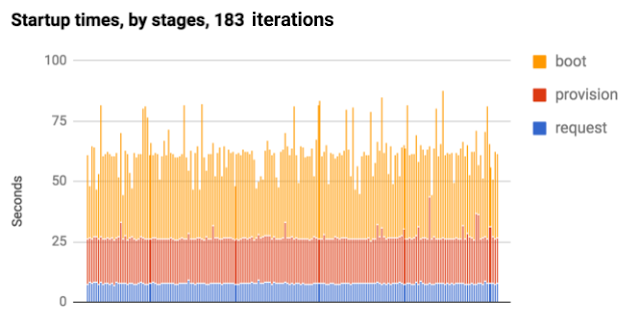
- Cycle time to instantiate a server.
-
Man-Months of backlog in innovations and defect fix effort
-
Man-Months of “Technical Debt”
-
Percent of work unplanned (“error budget”)
-
Percent of development (coding) innovation vs. repetitive work
-
http://www.veracode.com/services/veracode-vs.-on-premise-tools
See
- http://www.smlcodes.com/tutorials/hygieia-dashboard-tutorial/
Trends over time
Displays of trends over time are important to keep numbers in perspective, both to keep from over reacting to momentary anomalies and from under-reacting to underlying patterns that need to be fixed.
PROTIP: So it’s better to have a set of rotating dashboards (showing trends) than having just a number on a dashboard without context to whether that number is “good” or “bad”.
PROTIP: Have a projection of what was expected at each point in time, especially in the future.
Having an arbitrary target number can be counter-productive unless individual employees have a coherent approach that balances the many conflicting needs.
For example, an insistance on “100% all the time” can lead staff to prioritize caution over innovation.
QUESTION: Should trend information be considered during a Production Readiness Review (PRR)?
Financial and Strategic
Executives and business managers typically focus on financials :
- Total cost per transaction ratio
- Total cost as percent of revenue
- Total revenue per employee
Upper management need to manage over a longer time horizon. So they need to see trends over time, especially those that reflect customer experience (not just internal processes):
- Availability of the system
-
Productivity of end-users using the system being developed, such as
purchases, invoices, or other business transactions processed during a peak hour. -
Customer Net Promoter Score
- Employee satisfaction
- Employee turnover rate
Many may balk that the above are not “relevant” to DevOps. But if not, then how important is the justification for going DevOps?
Hygieia Build
http://www.capitalone.io/Hygieia/setup.html references code and automation at
https://github.com/capitalone/Hygieia
-
In a Google Compute Cloud Console.
QUESTION: Is there a Terraform template?
-
Within the Google Cloud Console execute:
curl -fsSL https://github.com/wilsonmar/hygieia | sh
-
Automation to instantiate a cluster of servers to establish Hygieia:
NOTE: Hygieia was written in Java to store data in a MongoDB database.
The Hygieia API server exposes REST APIs written in Spring Boot and mysema.querydsl.
The Hygieia core server provides the UI to data collected.
-
Fork https://github.com/capitalone/Hygieia to your own account.
-
Create a container folder to hold several related repositories.
git clone https://github.com/ My GitHub Acct /Hygieia
At the time of writing, this took up 131.1 MB of disk space.
git clone https://github.com/ My GitHub Acct /Hygieia –depth=1
At the time of writing, this took up 114.2 MB of disk space.
-
Download and build via maven using pom.xml file:
mvn clean install package
PROTIP: If you enjoy reading the deluge to the console, expand the Terminal width to avoid wrapping.
The response:
[INFO] Total time: 08:34 min
[INFO] Finished at: 2017-03-18T21:11:46-04:00
[INFO] Final Memory: 108M/1581M
At the time of writing, after install the folder takes 1.23 GB of disk space.
- Install MongoDB for the API data store
- Run collectors with properties to connect to CI tools
-
Seteup Dashboard widgets & Visualize
QUESTION: Can only have one dashboard?
PROTIP: Have computer programs monitor servers and take automatic actions.
More Info
https://gitter.im/capitalone/Hygieia
Videos:
-
https://www.youtube.com/watch?v=WuPQOBMmzSE [4:01] May 10, 2016
-
Introducing Hygieia [4:53] Jul 17, 2015 on CapitalOne’s GitHub
-
https://www.youtube.com/watch?v=WZ3S1xOn8Wg (music, no narration)
Hygieia configuration
There are several gulpfile.js within $HOME/gits/hygieia/UI/
- /gulpfile.js
- /node_modules/gulp-angular-filesort/node_modules/ng-dependencies/node_modules/estraverse/gulpfile.js
- /node_modules/gulp-angular-filesort/node_modules/ng-dependencies/gulpfile.js
- /node_modules/gulp-less/examples/gulpfile.js
- /node_modules/browser-sync/node_modules/dev-ip/gulpfile.js
- /node_modules/browser-sync/node_modules/browser-sync-client/gulpfile.js
- /node_modules/gulp-css-globbing/node_modules/vinyl-map/example/gulpfile.js
- /node_modules/gulp-csso/gulpfile.js
To change the default port, change the gulpfile.js from $HOME/gits/hygieia/UI/
      browserSync.init({
          server: {
              baseDir: hygieia.dist,
              startPath: '/',
              middleware: [proxyMiddleware]
          },
          ghostMode: ghostMode
      });
to this:
       browserSync.init({
          port: 9999,
          server: {
              baseDir: hygieia.dist,
              startPath: '/',
              middleware: [proxyMiddleware]
          },
          ghostMode: ghostMode
      });
More on DevOps
This is one of a series on DevOps:
- DevOps_2.0
- ci-cd (Continuous Integration and Continuous Delivery)
- User Stories for DevOps
- Git and GitHub vs File Archival
- Git Commands and Statuses
- Git Commit, Tag, Push
- Git Utilities
- Data Security GitHub
- GitHub API
- Choices for DevOps Technologies
- Pulumi Infrastructure as Code (IaC)
- Java DevOps Workflow
- AWS DevOps (CodeCommit, CodePipeline, CodeDeploy)
- AWS server deployment options
- Cloud services comparisons (across vendors)
- Cloud regions (across vendors)
- Azure Cloud Onramp (Subscriptions, Portal GUI, CLI)
- Azure Certifications
- Azure Cloud Powershell
- Bash Windows using Microsoft’s WSL (Windows Subsystem for Linux)
- Azure Networking
- Azure Storage
- Azure Compute
- Digital Ocean
- Packer automation to build Vagrant images
- Terraform multi-cloud provisioning automation
-
Hashicorp Vault and Consul to generate and hold secrets
- Powershell Ecosystem
- Powershell on MacOS
- Jenkins Server Setup
- Jenkins Plug-ins
- Jenkins Freestyle jobs
- Docker (Glossary, Ecosystem, Certification)
- Make Makefile for Docker
- Docker Setup and run Bash shell script
- Bash coding
- Docker Setup
- Dockerize apps
- Ansible
- Kubernetes Operators
- Threat Modeling
- API Management Microsoft
- Scenarios for load
- Chaos Engineering