

How to achieve work productivity, high availability, scalability, resiliency, low latency, at lowest cost?
![]()
![]()
![]()
![]()
![]()
![]()
![]()
![]()
![]()
![]()
![]()
![]()
![]()
Overview
- Software Testing Tools Landscape
- Static vs. Dynamic CMS sites
- Executable app architectures
- SaaS (Software as a Service) for apps in the cloud
- “Serverless”
- Tuning required
- Single instance hosting
- Business Objective Economics
- Load Testing
- Server images
- Multiple instances for elasticity, reliability
- Monitoring agents
- Auto-scaling
- Automation to avoid runaway bills
- CloudFormation Templates
- Load Balancing
- A/B Testing
- AWS Lightsail
- Istio and Envoy for Tracing
- Recap of tasks
- References
- Pluralsight videos
- Wait, there’s more. Click one of these …
This is my draft of sequencing a logical presentation about how to ensure scalability, availability, resilience, and affordability from building, testing, and running computer software applications in production on various cloud environments.
NOTE: Content here are my personal opinions, and not intended to represent any employer (past or present). “PROTIP:” here highlight information I haven’t seen elsewhere on the internet because it is hard-won, little-know but significant facts based on my personal research and experience.
- I begin with the “Full Stack” Testing Tools Landscape
- Static vs. Dynamic HTML generation and CDNs
- Executable app architecture
- SaaS
- Single-instance
- Multiple (clustered) instances with auto-scaling
- Serverless
- Auto-scaling
- Container scaling
- Amazon Lightsail
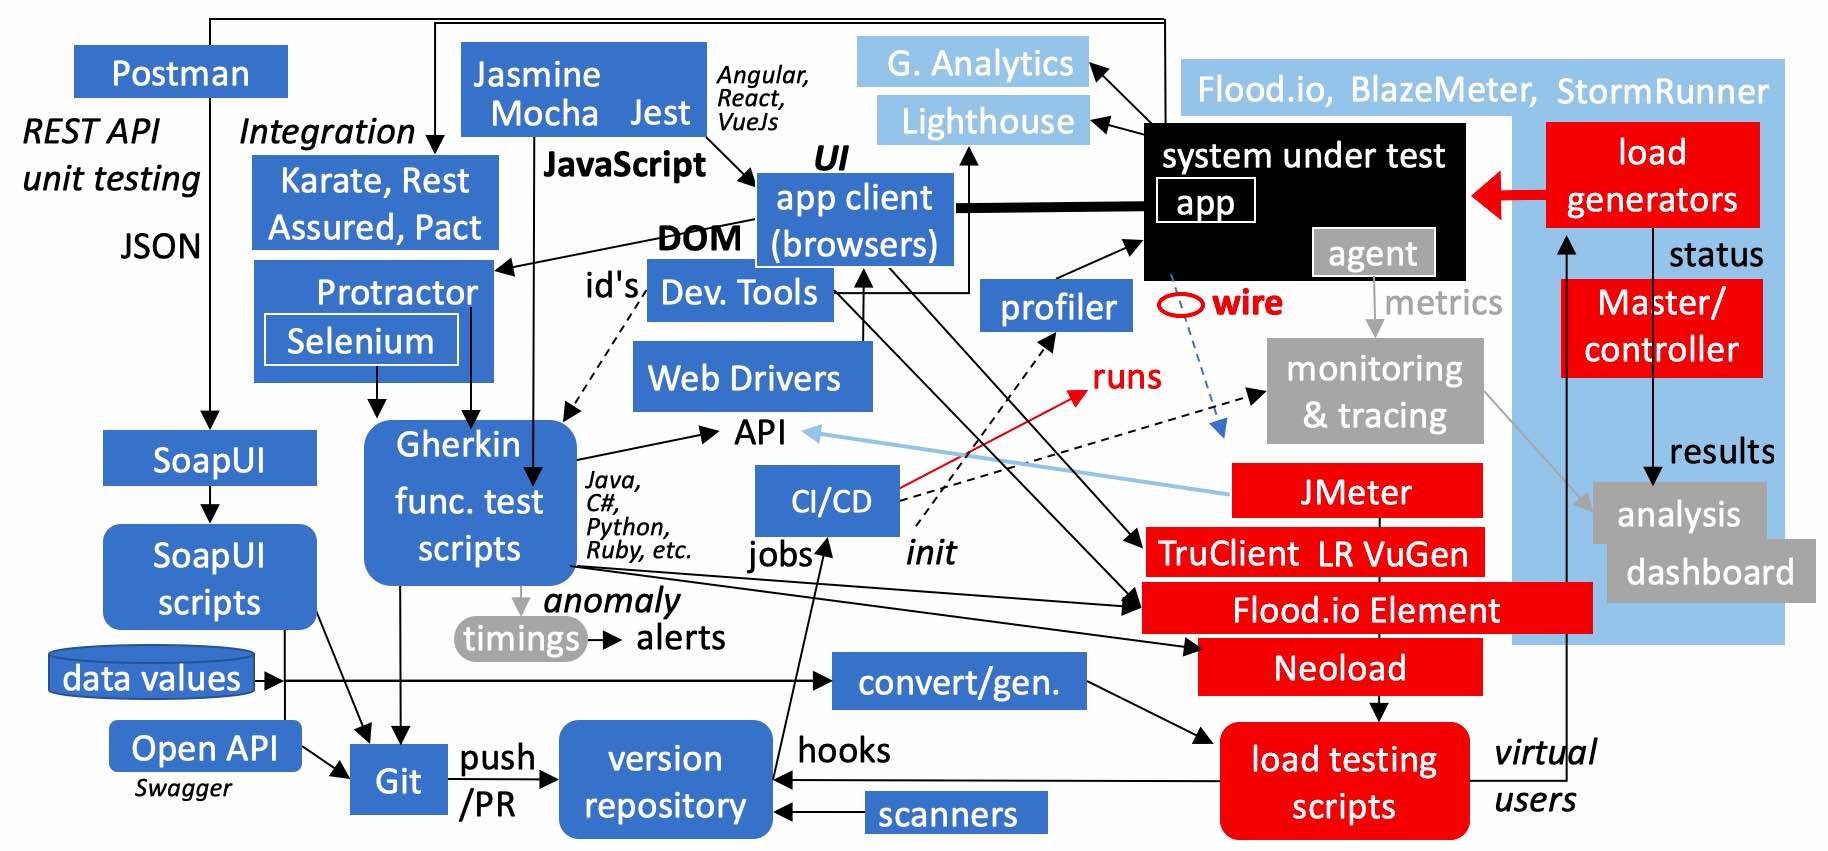
Software Testing Tools Landscape
In this diagram, a lot is going on because I wanted to describe the overlap between key tools for both functional and performance testing, supporting unit to integration stages of development.
I’ll be revealing each line and box at a time, starting from apps running in a system under test, accessed by an application client which today is typically an internet browser such as Google Chrome running on a laptop.
There are several different types of testing throughout the development lifecycle. One aspect is to see whether the User Interface (UI) displays what users are intended to see. This is typically called “functional testing”. What users see on browsers today are changed by JavaScript which manipulate what is in each user’s browser Domain Object Model, abbreviated as (DOM).
Another type of testing targets unit testing of REST APIs (Application Programming Interfaces) which computers use to talk with other computers without human interaction, usually transferring JSON-formatted files. Functional integration tests see how various services interact with each other.
Then there is load testing which imposes an artificial load to surface issues. It’s done to identify whether the infrastructure can indeed deliver acceptable response time, absorb spikes, scale well, not leak memory, and meet other what are called non-functional requirements.
Tools for both categories are here in one diagram because job descriptions are now asking for skills that used to be in previously segregated jobs. Load testers must now know functional tools. Site reliability engineers who used to just monitor things now must also know how to insert synthetic loads. Developers are expected to know everything. That’s the new strategy for small Agile teams.
So let’s dive in a bit deeper.
Development teams code JavaScript (even while offline) to use Google’s Angular, React from Facebook, Vue, or other library. Google created Jasmine to test code using Angular. Jasmine had a “batteries included” approach, so Mocha came along with a focus on assertions, and depended on other libraries such as Chai to innovate on mocking, snapshotting, and other features. Then Jest was created along with React by Facebook, with the same “one library does it all” strategy, with even more features than Jasmine. These are unit testing tools.
Built into the Chrome browser are Google’s Developer Tools which are used to manually identify the identifiers used to automate the clicking and typing in the UI. Selenium scripts reference those identifies through a Web driver program which controls each browser. Each web driver exposes an API that automated testing scripts call. This design is why functional test scripts can be written in any language (Java, Python, C#, etc.). Selenium provides a framework for organizing the scripts.
Protractor adds to Selenium the Cucumber library so it can interpret the Gherkin written language to specify tests in a more natural way. Protractor also has a better way to dynamically read the DOM (Document Object Model) which stores the state of each user’s browser which Angular, React, Vue, or other UI libraries manipulate via JavaScript.
API Unit & Integration Testing
To unit test API services exposed by an app, developers often use Postman or SoapUI because they are a free open-source tool. BTW SoapUI also tests REST APIs exchanging JSON-formatted data as well as SOAP XML.
Karate, Rest Assured, and Pact are called integration testing tools because they are used to catch errors in dependencies among services needing each other.
Performance?
Those who seek to “left-shift” testing for performance make use of Google’s Lighthouse audits to get recommendations about techniques to speed up browser display, right in the Chrome browser under Developer Tools.
Google Analytics provides timings for web traffic in public production.
In the current movement toward reusing functional test scripts for use in performance testing, one approach is to modify functional test scripts to obtain timings on each step within the app, and store them in a time-series database so that alerts can be issued when anomalies are detected.
But the principal approach for performance engineering is to create an artificial load on apps using load generators operated by load testing scripts that replace manual work on real app clients with “synthetic” or “virtual” users. The number of virtual users is often used to define the level of load imposed by scripts. While load is being injected, status such as the rate of transactions and errors encountered are reported by load generators to some master controller.
Metrics such as CPU and memory utilization within servers are obtained by Dynatrace or other monitoring agents installed on servers. Results from runs are then analyzed and presented in dashboards.
Traditionally, to get load generators to run as many virtual users as possible, load testing scripts don’t duplicate what occurs in the browser, but mimic just what is exchanged over the network wire between an app and its clients. Communications are captured as load test script lines, then edited to add correlations and verifications. That’s what LoadRunner’s VuGen, JMeter, and other proxy-based client emulators do.
Then innovations such as http/2 asynchonous communication and AngularJs code running within browsers cause more and more processing within browsers instead of on servers. So TruClient for LoadRunner was created to record and emulate the DOM and actions of each individual virtual user such as clicking buttons and typing on forms.
JMeter scripts can also make calls to Web Driver APIs like Selenium, albeit with some limitations.
Taking an alternative approach, Neoload can call Selenium scripts as well as scripts created the traditional way.
The newest innovation is Flood.io’s Element, which, instead of calling Web Driver APIs like Selenium, calls the newer DevTools API protocol using the open-source Chrome Puppeteer headless browser control technology, both from Google. Their Element scripts can be converted from TOSCA functional test scripts, which uses a low-code approach. That’s why they are the new darling among those who test SAP and Salesforce.
This keeping track of each user’s browser memory can take up a lot of RAM, so cloud-based services makes sense, to use a lot of load generators for a short time, making cloud more affordable than having to buy a bunch of on-premise servers. Cloud services include StormRunner, BlazeMeter , Flood.io, and others.
To load test APIs, tools such as LoadUI automatically convert SOAPUI unit testing scripts into load testing scripts. SoapUI and Pact files have the advantage of containing data values specified during recordings. Open API (Swagger) specs do not contain data values, but variation in a large number of values are needed for any long-running load test anyway.
To achieve “shift left”, our objective is to begin load testing as soon as code is pushed or merge from a local Git repository to GitHub (or other Version Control repository).
Part of the modern development toolchain are static code scanners and dynamic code profilers to detect issues while the code is still fresh in the developer’s mind. This also applies to security type testing.
Hooks in the repository can automatically initiate build of app instances, monitoring, profiling, and other preparations before kicking off a load testing job. When a cascade of automation can step through several test environments if all tests are successful, changes can happen safely yet quickly – so quickly that they are called “continous integration and delivery”, or CI/CD.
Recap:
Landing Page Efficiencies
More potential and actual customers visit on-line than in person. So it is even more important for an organization’s marketing landing page to be fast as its headquarters lobby to be stylish.
Google’s Page Speed Insights points out internal issues such as whether images are compressed enough and the many other specific tricks to make the site as fast as possible.
-
testmysite.ThinkWithGoogle.com evaluates mobile through 3G and 4G networks. Google Speed Scorecard compares the speed of various sites in one table.
-
webpagetest.org shows what users see, in slow motion</a> of pages in various stages of completeness.
-
http://checkgzipcompression.com reports whether a site has Gzip enabled.
A public cloud enables test clients to be quickly installed around the world to evaluate customer experience. Several sites track uptime availability and how fast landing pages load from various points in the world:
- uptrends.com, for free, tracks hits to a website and emails to business email addresses
- also looks for text on a page to alert to detect defacement, and display results to a public site. For up to 50 sites per account.
- yslow.org is based on work at Yahoo in 2001.
- GTMetrix.com includes mobile timings from Samsung Galaxy Nexus phone.
- Pingdom.com, associated with SolarWinds, says free but it’s really a 15-day trial.
- https://tools.keycdn.com/speed
- https://www.dotcom-tools.com/website-speed-test.aspx
- http://pagelocity.com/
CDNs for static vs. Dynamic HTML generation
Instead of a URL using the same host name (server) as HTML, it is now common for images, video, and pdf files to be served on a Content Delivery Network (CDN). Such as Amazon’s cloudfront.net:
- “https://d20vrrgs8k4bvw.cloudfront.net/documents/en-US/nd209_Robo_syllabus_v2.pdf”
Companies offering CDN services include AWS CloudFront, Microsoft Azure Blob CDN, Google Cloud CDN, Akamai (IBM), CloudFlare, Fastly, Netlify, etc.
Sites running Google Cloud CDN have a single IP address that can run everywhere (do not require a separate regional DNS). IBM provides Wildcard Certificate and Domain Validation (DV) SAN Certificates. AWS can encrypt individual fields.
Google transfers up to 5TB objects.
QUESTION: How much faster does a CDN (Content Distribution Network) provide resource to viewers in different parts of the world? Google charges based on cache fill bandwidth and cache egress bandwidth as well as HTTP/HTTPS requests.
QUESTION: Are resources retrieved faster on AWS Cloudfront because it offers the most Points of Presence (PoP)? (136 vs. Google’s 90+, Azure’s 54)? AWS serves Video on Demand
Static vs. Dynamic CMS sites
The architecture of Content Management Systems (CMS) such as WordPress and Drupal is that they dynamically generate HTML presented in response to each request from users. This is great for personalization, but is slower than the newer approach of having static HTML files sitting in CDNs distributed for fast retrieval.
The programming that does the generation within WordPress is written in the PHP programming language. PHP is an interpreted language, meaning that PHP programming source code is processed by the PHP interpreter program every time to respond to each new request.
WordPress and Drupal are among the most popular programs running on the internet because of its vast ecosystem of developers and add-on functionality. To many, the overhead of PHP is worth the features provided by PHP sites that use SugarCRM, WooCommerce, and many others.
Executable app architectures
PHP and Python are usually slower than programs written in Java, Go, or other programming language compiled into low-level run-time files that computers execute.
Java programs require the additional installation of a JVM (Java Virtual Machine) that allocates memory among programs. The programming language Go comes with its own run-time environment.
The difficulty with both interpreted and compiled applications is that one must setup a server and populate it with the software, then configure it. Over time, reconfigure it for security patches (such as for TLS 1.2, Heartbleed, etc.).
Business owners who had a website built must continue to pay thousands of dollars each year for “maintenance” to keep it running. Patches for operating system security, the PHP interpreter – every aspect of technology – must be updated ocassionally. This constant maintenance does not add additional functionality to the end user, so is feels like a disruption and waste of time and money.
Enter SaaS in a cloud.
SaaS (Software as a Service) for apps in the cloud
To take advantge of the availability of the internet, in the late 1990’s software vendors such as Salesforce emerged to offer users functionality completely through an internet browser. Such vendors take care of providing the underlying technologies such as operating system software, databases, and the “framework” that enables customization of functionality. SaaS vendors also handle hardware provisioning, making sure to have whatever number of servers are available, behind the scenes, like dining at a fine restaurant.
As with regular use of fine restaurants, SaaS offerings can seem expensive to some, costing thousands of dollars for every user, plus additional costs to hold storage. For example, Salesforce charges $5,000 to store one Terabyte of data each month, compared to a multi-terrabyte USB drive for a $100 dollar one-time purchase.
Those who develop using a framework such as Salesforce must first learn all the intracies of their framework and unique programming language – which can take many months of serious study.
Enter Serverless.
“Serverless”
Since “Severless” software development capabilities was made available by cloud vendors beginning in 2016, it is capturing the fascination of cool application developers because a developer only needs an internet browser (such as Google Chrome) to create and run applications.
The term “serverless” means that developer does not need to hassle with acquiring server hardware. The cloud vendor (Amazon) provides all the processing.
The advantage of Serverless over SaaS is that the programmer can develop individual “functions” with a more “lightweight” framework reusing other’s coding. Functions can be written in several languages (Python, Go, .NET C#, etc.).
But there is a “hassle factor” with Serverless.
Tuning required
With both SaaS, Serverless, and other shared-cloud environments, programmers must ensure that their code does not run too long or take too much memory, lest the cloud vendor issue errors that prevent execution. This is needed both because custom code runs within an infrastructure with others and because costs accumulate for each request made.
Such does not seem as important for those who stand up their own server to host WordPress.
Inefficiencies in WordPress configurations and programming are hidden as lower capacity unless investigated.
Single instance hosting
Many web hosting companies have sprung up to offer hosting of executables (such as WordPress) on the internet. Several charge just $5 a month or less for a small site. Such offerings provide a single “process” for each website. And other websites are on other processes on the same server.
An issue with shared hosting is that several websites on the same server share the same IP address. So if one of the website is marked as being abusive, all other websites sharing its address also become blocked.
The trouble with a single stand-alone instance is that when a gradually increasing load is placed on it, eventually the server would become overloaded and fail. The level of transaction throughput at the point of failure is determined by “stress tests”.
There are several ways to increase capacity on individual servers.
One alternative is to allocate more RAM on the server to cache and buffer transactions within each server.
In order to get a given server to process more load, its hardware components can be upgraded manually. This is called “scaling up”.
Magnetic hard drives are slow – many times slower than the rate CPUs transfer data. But modern SSD (Solid State Disc) drives used today are 8X faster. Typical throughput rates:
- Hard disk = 30 MiB per second. (x8 = 240 Mb/Sec)
- Gigabit Ethernet = 125 MiB per second. (x8 = 1,000 Mb/Sec)
- Solid state disc = 250 MiB per second. (x8 = 2,000 Mb/Sec)
- Fibre Channel = 2,550 MiB per second. (x8 = 20,400 Mb/Sec)
(That’s why AWS does not allow the use of magnetic drives as a server boot-up data volume.)
Server manufacturers usually provide more speed along with larger capacity:
- More cores (vCPUs) and faster CPUs come with larger RAM
- Faster disk types come with larger capacity disks
- Faster network performance (speed) interfaces come with larger capacity network pipes
For example, to get a server with more RAM, you also pay for more cores (vCPUs) whether you want it or not.
A doubling of RAM usually costs twice as much, or more. However, upgrading usually doesn’t yield the same increase in how much is processed. For example, a doubling of RAM does not usually yield a doubling of transaction throughput.
QUESTION: So one question performance engineers are asked to answer is whether running two smaller servers processes more transactions than a big server with the equivalent memory of several smaller servers.*
BTW, Amazon sells RAM memory by “GiB” (for Gibibyte) rather than the more traditional “Gigabytes” used by hard disk drive manufacturers to mean 1,000,000,000,when using a “base 10” method of counting, where each digit can have 10 values (from 0 thru 9). Counting each digit, that’s 10 to the 9th power.* A Gibitype is based on “base 2” (1 or 0) counting that computers use internally, and 2 to the 30th power which is equivalent to worth 1,073,741,824 bytes in base 10. The difference between the two increases exponentially as numbers get larger: about 7% at the Gibibyte/Gigabyte level but 9% at the Tibibyte/Terabyte level (the equivalent of 1,099,511,627,776 bytes in base 2).
More “advanced” types of servers can be configured to use Single-Root I/O Virtualization (SR-IOV) and Elastic Network Adapters (ENA) which deliver 20 Gbps (Gigabits per second) speed. The logical spread of low-latency instances within a single cluster placement group is defined within a single Availability Zone. BTW Cluster placement groups are defined to ensure that instances in one partition do not share underlying hardware with instances in other partitions.
QUESTION: Are the higher packet per server (PPS) performance the the above enhanced networking mechanisms worth the price? Nodes within the same placement group communicate at the full line rate of 10 Gpbs flows and 25 aggregate without any slowing due to over-subscription. PROTIP: If you are using AWS Direct Connect, private pipes to other data centers are 50 Mbs to 10 Gbps, depending on what you pay for.
Another alternative for increasing throughput is to add a separate caching server (such as Redis, MemcacheD, AWS RDS, or ElastiCache) that tries to respond to requests before they hit the web server or database server. Cache servers typically holds responses in a large amount of memory. But to ensure that money for a caching server is not wasted, the cache hit ratio should be measured when running under simulated load.
Business Objective Economics
The potential for failure due to load may not be of concern for “vanity” websites which don’t anticipate a lot of traffic.
But most businesses websites prefer their websites to be able to handle more business without much manual vigilence.
The big takeaway from this line of thinking is that here we focus on the business objective of obtaining the safest way to achieve the highest rate of business transactions at the least total cost.*
The total cost calculation should include the cost of dissatisfied customers who cannot reach the website or abandon the site (and not buy) when it’s too slow due to it being overloaded.
Total costs also includes the time to build and maintain the software.
And also for testing.
Actual availability
This table of availability SLAs and outage limits:
| SLA | Nickname | Down/year | Down/Mo. | Instances | AZ's |
|---|---|---|---|---|---|
| 99.90% | 3 nines | 8.76 hours | 43.2 min. | 1 | 1 |
| 99.95% | 3 and a half nines | 4.38 hours | 21.56 min. | 2 | 1 |
| 99.99% | 4 nines | 52 min. 36 sec. | 4.38 min. | 2 | 2 |
| 99.999% | 5 nines | 5 min. 15 sec. | 26.30 sec. | services | 2+ |
- 99.95% is GitHub’s SLA for Enterprise subscribers
- 99.90% is Azure’s SLA
Load Testing
A business can’t wait for production (paying) users to generate the load to see if the system really works because then it would be too late .
Compared with the negative consequences of business risks, load testing is needed to identify risks that otherwise lay hidden. For example, programs that open a new connection with the database to service every user (rather than “pooling” connections for reuse) would require additional memory to be allocated on the database. So load tests are needed to determine optimal configuration settings.
Load testing is done to identify errors in design such as memory “leaks” that consume more and more memory over time, requiring each production server to be rebooted. Load testing is needed to determine how often rather than using some arbitrary time like once every night. Some data centers find they need to reboot every hour.
Traditionally, load testing occurred near the end of projects, but to enable Agile practices, many businesses today seek to “shift left” (ahead in time) so that risks are exposed as development occurs so that they can be fixed while the code is still in developer’s minds. To facilitate that, load tests (along with monitoring) can be made to automatically begin (by a Continuous Integration utility such as Jenkins) when code is uploaded to a team source repository.
Planning for load testing includes characterizing the load coming from various use cases (how many people registering, browsing, buying, etc. at the same time).
Running servers in the cloud makes performance testing easier and more economical than duplicating the set of production equipment on-premises, which include not just web servers but also utility servers such as DNS, Active Directory/LDAP, etc.
QUESTIONS: About your app/system:
- Do users see a formatted “server unavailable” screen when the URL they use does not reach a working service?
- How quickly can users ramp up? What is “too quick” of a ramp-up?
- What is the optimal rate (per second) transactions can be processed before UX degrades?
- Does the system come up quickly?
- Does the system leak memory or consume too much disk space over time?
- What is the highest temporary spike the system can absorb temporarily?
- How much time does it take to obtain additional capacity (from realization to actual availability)?
-
Can instances be decomissioned automatically? (elasticity)
- Does the system recover fully after a failure? (resiliency)
- What is the signal threshold to request additional capacity?
- What is the maximum nominal load on normal days?
- How much headroom is there for future growth?
These questions are answered by various types of performance testing.
“After you have identified your architectural approach, you should use benchmarking and load testing data to drive your selection of resource types and configuration options” – 512 in Amazon’s “Performance Efficiency Pillar: AWS Well-Architected Framework (AWS Whitepaper)
Performance test run types
I’ll be presenting this diagram about types of performance testing one concept at a time. The work of performance testing is about imposing different levels of load over a period of time. The intensity of load imposed is typically defined by the number of virtual users that load generators inject.
The outcome from load testing experiments is the rate of processing (stated in hits per second or per minute) which the server can sustain, a metric that can be monitored in production. Finding that optimal rate is one of our major objectives because we want to provide actionable intelligence to Operations in production.
The first thing, even while the application is being built, is a way to return a “service unavailable” page if the application doesn’t respond to browsers pointed at it. It’s useful to have an availability check on the server running around the clock at perhaps an infrequent one requst every 10 minutes (that’s 6 per hour or 144 hits oer day). This is so that if it’s down, you’ll get an email, because that affects employee and customer productivity and satisfaction. Many such services are offered free.
We begin by identifying the quickest rate users can optimally ramp-up. We need to know the maximum number of users who can really jump on the system at about the same time. This is so we can predict what will happen at the beginning of a call-center shift or some peak time. The rate new users enter the system can cause a bottleck as well a high number of concurrent users running, because limitations in the authentication infrastructure is often a bottleneck.
The scenario that keeps adding more and more new users is called a Stress Test. If we start with a very aggressive rate where we see error messages, we’ve made progress because every set of machine has some bottlenecks, and our job is to find them. When we identify a particular rate that is “too quick”, we ask is it the memory? CPU cycles? Network? Such information is the “heads-up” that Operations people need to know.
We usually need to try different rates to bring up the most number of users the quickest.
Stress test scenarios are used in Fail-over tests run to ensure that users can indeed be diverted to another availability zone or region for disaster recovery.
The point we want to find is NOT the server’s breaking point, but right before user experience (UX) degradation occurs, when response time begins to suffer due to load. That is the true capacity of the system under test.
From that capacity level we add lead time to calculate the threshold when we request additional capacity. If we have on-premises machines, the lead time can be like 6 months. This is why companies working with a fixed capacity would over-buy to get headroom to absorb future growth that may not come. The value of an elastic cloud such as Amazon and Azure is that we pay only what we use, when we use it.
Doing load testing helps us be more precise than just guessing at a CPU percentage as the threshold for bringing on another machine. Within a cloud, the lead time to bring up additional capacity includes the time it takes to recognize that additional scaling is necessary. The less headroom we allow, the more usage we can get out of machines we pay for.
We calculate headroom based on the nominal actual level of load – the momentary peaks reached during each day, the level where long soak tests are run to ensure the endurance of the system over time – to ensure that the level is sustainable without memory leaks and excessive use of disk space.
This nominal rate is also what we use in the “flat” portion of Smoke tests after a ramp-up. Such runs »> also called “Canary tests” «< sustain the nominal load for a short period of time, such as 10 minutes, to prove the viability of an environment built after configuration changes.
We do Spike Tests to verify resiliency – the ability of the system to absorb sudden temporary spikes in load while maintaining adequate response time. The system should then return to previous levels of memory usage when back at the nominal rate of operation.
If we operate a cluster of servers, we need to make sure we have the elasticity we hoped for.
In an elastic cloud environment, we need to ensure that our configurations can indeed instantiate additional capacity on a timely basis. Tests of elasticity should also include un-instantation tests to make sure that instances are indeed reduced when load recedes below threshold levels.
Recap

Here is the list of the types of performance tests covered in the previous illustration.
Items in blue font relate specifically to cloud environments built using automation, such as the threshold to begin scale-out.
Metrics about lead time are important because time is money when we’re charged by the minute in the cloud. The faster we can ramp-up to that maximum rate, the less we have to pay. The same can be said about ramping down. Being able to tune systems is where performance engineering efforts really pay off.
Having additional instances for testing performance and fail-over is a game changer because it allows simultaneous parallel streams of work to conduct stress tests. Environments need to be otherwise quiet to properly measure memory usage during performance tests. A system is not really usable while it’s purposely being brought to the point of degradation.
Having automation and alerting allows us to be quicker at implementing stop-gap measures such as rebooting servers to reclaim memory. Rebooting is not the ideal situation, but it buys us time to focus on root issues.
A comprehensive set of tests in each environment is what makes automatic and fast deployments doable.
But people in Operations who protect the production environment are usually skeptical.
So I think smoke tests that include performance testing can have a more important role than many may realize.
We know that rendering judgement about pass/fail too early in the development cycle can stifle innovation and experimentation.
But I’d like to propose a metric that evaluates the “success” of smoke tests.
“Infant Mortality Rate”?
To illustrate the status, I’ve been using an analogy.
In the medical community, the “Infant Mortality Rate” refers to deaths of live-born babies within the first year of life. Neonatal mortality rates refer to the first 28 days. Early Neonatal Mortality refers to the first 7 days of life.* They are measured in terms of every 1,000 live births as a proxy measure of the quality of healthcare within a country. For example, the US has over time improved infant mortality, but at a slower rate than other developed countries:

(The lower the rate, the better).
The equivalent metric for computer systems would be improvements in failure during smoke tests per 1,000 deploy attempts in Staging.
Would you agree with the statement that “the Staging environment is a not a playground?” and that “Issues in Staging should have been identified in lower-level environments”?
Many Operations people don’t expect (or even tolerate) issues in Staging. But many developers think differently, and that may cause conflict and distrust.
So should discovery of performance issues and tuning occur in Staging? Being able to spin up duplicate environments in the cloud would help us avoid using Staging as a playground.
What do you think? Would tracking this metric reduce concerns in Operations people who protect their production environment? Would it reduce distrust by providing factual history?
Leave a comment below! Let’s have a discussion about this.
Server images
Many organizations today build all aspects of the server they use by defining programming code “configuration as code” such as Ansible, Cloud Formation, Terraform, Chef, Puppet, etc. Such an approach include the storage of configuration code in a source version control repository which can retrieve the full set of all files as they were at specific points in the past. Version control systems such as GitHub and GitLab also track who made changes and why (in comment messages).
Server images created by the configuration code can be saved as server images in binary repositories such as Nexus and Artifactory. The server images are used to spin up each server instance. When developers share an image with testers, what is tested is exactly what developers end up with. When testers and operations share an image, what is used in production is what has been tested.
There is another advantage to using server images. For example, Wordpress is written as an open-source application, so anyone can customize it. So various teams have created server images that incorporate a pre-tested set of various components and features such as containing a storefront, or one that has been tuned for efficient and fast running.
There are several different types of server images:
- AMI (Amazon Machine Images) within AWS (Amazon Web Services)
- Virtual machine DisK files (VMDKs) running on VMWare or VirtualBox
- Virtual Hard Disk (VHD) files used with Microsoft Virtual Server and Hyper-V hypervisors
- Docker containers from DockerHub.com, Quary.io, etc.
All the images (except Docker) contain the underlying operating system and utilities in each image.
Some AMI creators charge its users money. But many pay it because it saves them hassle and time.
QUESTION: Is the extra cost worth the extra savings? Load testing can answer that question.
BTW: Historically, Intel processors are used by AWS, but in 2018, machines with ARM processors became available, for a 40% cost savings.
QUESTION: To determine the cost of processing using any given server configuration, one needs to measure use of processing, storage, network data transfers, etc. at various levels of user load accessing the server at various points as load increases.*
Instead of just testing, “performance engineering” yields configuration changes which identify cost savings.
NEXT: Server images are necessary to create multiple instances of the same application, for “elasticitiy”.
Multiple instances for elasticity, reliability
If your website is successful in growing visitors, load at peak would grow beyond what a single server can handle.
Then multiple servers would be needed for “elasticity” – the ability to deal with variations in load by adding more resources during high load or consolidating when the load decreases.
Amazon brands several of their services with the name “elastic” to highlight that aspect of their offering.
Multiple servers are also needed to ensure reliability – to have another server take over in case a particular server fails, to ensure “high availability” (“HA” for short).
Fail-over tests measure whether fault tolerance can really occur. Testing that deliberately downs a server to measure the speed of recovery is called “resilency testing”.*
Time to Additional Capacity
The concern with scaling is how quickly additional capacity is added.
The traditional on-premises approach is to order and buy excess server hardware based on projected peaks many months or years in advance. Thus, servers would use a fraction of their capacity, which remains unused much of the time. And if processing volume exceeds the peak, the whole system would degrade or fail.
A cloud of servers such as Amazon AWS pools unused capacity among many customers for allocation when needed.
But although capacity can be added dynamically, it needs to be added on a timely basis – before need to provide a margin to handle growth while additional instances are brought up.
Bootstrapping instances in ASG can take 10 minutes or more. To avoid false alarms from being in “pending:complete” state before bootstrapping completes, create an ASG Lifecycle Hook to hold instance in a “pending:wait” state until bootstrapping completes. Hooks time out after 60 minutes. But an API call in the bootstrapping script can release the hook.*

In total, it can take 20 minutes or more between the request and when a new server being able to process application transactions. It helps to track the actual time in order to design auto-scaling settings.*
Standby servers
So some operators define one or more “standby” server instances to instantly process sudden increases in load while additional servers spin up. The number of such servers are determined by “spike tests” which emulate sudden increases in load.*
Storage costs and complexities
TODO: The complex way that AWS charges for disk drives (input/output) make spike tests useful to determine real costs.
DOCS: AWS Auto Scaling Limits
How to identify trigger levels
Now that we’ve identified the point of UX degradation using Stress Testing and the level of nominal average load expected, we now can calculate the lead time and trigger levels for elasticity.
The two horizontal lines are the two trigger levels we need to identify: one to increase capacity and one to decrease capacity.
The load level we reach for a short time during Spike Test runs is the “spike capacity level”, which we calculate to be slightly higher than the highest momentary peak expected above the normal average load. PROTIP: In offices this often occurs around 11am during normal days, when everyone is at work on their computers.
Within environments seeking high availability, load would be split among a minimum of two hot instances within a cluster so that one machine would still be running in case one fails or is being replaced.
We run experiments using different types of machines offering different amounts of RAM, CPU, and other resources on each individual machine – scaling up and down to find the lowest cost machine type which can handle spike level loads but at acceptable levels of quality.
PROTIP: The smallest server type may not work. Peter Wayner conducted a cloud benchmarking exercise on AWS in 2013 using the open-source Java-based DaCapo benchmark suite. He found that the least expensive virtual server type AWS provides, T1 Micro ran eight to 10 times slower than the M1 Medium, with more variability, and often failed to complete a task and thus not “enterprise worthy”. «<
To avoid overloading machines, which causes poor performance, we may have to scale up to a more powerful machine so there is enough headroom to grow load while additional instances are getting prepared.
This spike level of load is also where additional instances are un-instantiated.
During Spike Tests we identify the various metrics to trigger reduction in the number of instances. On the Azure cloud, the spike level can be defined with more metrics than just CPU utilization. Some apps are more CPU bound, memory bound, disk bound, or network bound.
When we ramp up again to the point where capacity should be automatically added, the trigger to add capacity is determined by experimentation to identify the lead time needed to bring on more resources before reaching that point of UX degradation we identified during initial stress testing.
In other words, the longer it takes to spin up another instance, the lower the trigger points need to be, to “buy time”.
Trigger levels are different for each resource because it takes different amounts of time and effort to obtain additional capacity for each particular resource. For example, having a Software Defined Network in the networking infrastructure would take less time to reconfigure than a traditional one.
Nevertheless, various metrics would, ideally, trigger changes in capacity at about the same level of load.
Over time, each application and mix of use cases will consume resources at a different pattern. That’s why repeated test runs are necessary multiple time during the life of the application.
Recap of the diagram:

Now let’s dive down further…
Monitoring agents
On AWS, to collect measurements and streamed to CloudWatch, a CloudWatch Logs Agent needs to be installed on each server instance.
From within a running instance, list all categories of metadata for that instance (such as ami-id, etc.):
curl http://169.254.169.254/latest/meta-data
AWS CloudWatch Log Groups are defined to capture and send alerts about specific errors to SNS (Simple Notification Service) emails.
After 60 days, logs can be sent to AWS Glacier for lower-cost longer term retention if a S3 Lifecycle policy is defined.
Currently, CloudWatch does not aggregate data across regions.
BTW, for security, there should be different accounts to read and write. The account that can write should not be able to delete.
Monitoring granularity and fidelity
Automated monitoring and alerts replace the need for constant human vigilence, so you can sleep better at night rather than worrying.
Some organizations prefer to automate all aspects of setting up computing capabilities – installing the operating system, drivers, etc. This enables the organization to quickly respond to “zero day” security vulnerabilities which can crop up in any part of a system. This would also enable the organization to take advantage of lower prices for “bare metal” server instances from IBM and (since 2018) AWS. But is the total cost of running bare-metal boxes really cheaper than other approaches?
The default granularity of AWS monitoring service (CloudWatch) is one datapoint every 5 minutes, and does not include monitoring of memory usage. Monitoring of memory usage and granularity of 1 minutes can be configured (at additional cost). But that still doesn’t cover situations where sub-second ganularity is needed to inform debugging of “micro events”.
To save on disk space, many monitoring vendors sample readings from among servers, taking perhaps just 1% of all readings captured. This would reduce the fidelity of a specific server even more.
To further save on disk space, many traditional monitoring utilities truncate data of more granular detail over time. For example, individual data points collected are deleted after a week. Some keep just the average of each day’s measurement. This is not a useful practice for helping with debugging issues over time. A compromise is to calculate and store, in addition to averages, 90th or 95th percentile calculations.*
So when there is a cluster of machines, use general metrics to determine whether they are all using comparable amounts of CPU, memory, etc.. (An example of such a metric is the running Coefficient of Variation (CV) obtained by dividing the standard deviation into the average.)
CPU measured as “busy” (not idle) may be really just “stalled” waiting for resources. The “showboost” and “pmcarch” utility measuring instructions per cycle (IPC)
More granular metrics on just one of the servers within a cluster can then be used. This would reduce disk space usage for metrics. This would also provide an indicator of the impact of adding more grandular measurements to a machine.
On the metrics dashboard, one line representing whether all servers are at a similar level of load can replace a graph containing separate lines for each server. Taking that further, one line can represent whether all metrics about a cluster are “nominal” can replace a whole set of lines about each metric about a cluster. That’s kinda like a person’s FICO (finacial) score that consists of several aspects of credit trusworthiness.
QUESTION: How much time elapsed between alarm and reponse? This would involve recording events in a database, with analytics on that database. Within AWS, CloudWatch would store a new row within RDS.
Furthermore, an email, SMS text, or Slack notification can be sent out when a thresholds or events occur. Within AWS, send SNS notifications when an Auto Scaling groups launches or terminates instances
To get ahead of events, how long could the alarm event could be predicted? That’s where ratios might be used.
AWS CloudTrail logs report configuration changes such as which requests were made, the source IP addresses where the requests came from, who made the request, when the request was made, etc.
Auto-scaling
Amazon continues to offer traditional elastic load balancer service with auto-scaling groups of individual servers. The service is controlled using Chef specifications.
The concern with clusters of executable programs is sticky sessions which stay on a particular server instance until time-out, which can be several hours. Meanwhile, that particular server instance cannot be downed for security updates, memory reclaimation, or whatever. In other words, it takes a long time to “bleed” instances of user sessions. This situation is caused by programs that was written to depend on the exchange of cookies in HTTP headers exchanged between client and server. With such an architecture, Load Balancers need to return a client to a specific server instance, and thus not “stateless”.
Apps that are “stateless” can better take advantage of advanced scaling features.
Sticky vs. Stateless (more scalable and cheaper)
Apps need to be “stateless” in order to make use of server instances than can disappear at any time, such as AWS EC2 Spot instances purchased according to “spot rates” which fluctuate under an aucton system established by Amazon. Such rates are usually the lowest cost among all ways of charging. Thus, a system can be considered financially defective if it cannot take advantage of the lowest cost instances. Such a situation can and should be identified during technical planning stage. That is the rationale for considering performance issues early on rather than shortly before production when nothing much can be changed.
Speaking of “sticky”, there are sticky service charges …
Automation to avoid runaway bills
One of the risks with being able to get a lot of capacity quickly is that bills can pile up just as quickly, and sometimes inexplicably. Runaway bills are a concern when using clouds.
For example, when I kept being charged $35 a month on an account I provisioned server instances I shortly terminated, investigation by Tad Einstein from Google revealed that Google’s shutdown script doesn’t automatically remove Forwarding rules created when servers run within a cluster.

To delete Forwarding rules in a Bash script:
gcloud compute forwarding-rules delete "$FORWARDING_RULE"
To obtain the FORWARDING_RULE value, one can get a list manually via the UI at Networking -> Load Balancing -> advanced options -> Forwarding rules. Alternately, this command lists them:
RESULT=$(gcloud compute forwarding-rules list)
The RESULT variable above captures the list of forwarding rules created. If there is a possibility that there are several, it is necessary to select the specific rule to delete. So ideally you would build up the whole environment each time so there is no question there is no lingering rules.
CloudFormation Templates
Templates for CloudFormation automate the creation of components around the creation of a cluster of EC2 servers. An alternative are Terraform specifications which are multi-vendor (Azure, Google, etc. as well as Amazon).
Auto Scaling Template Snippets from AWS
Affinity Groups
A big concern with measurement during load testing is the time between client request and (the first byte of) response from server. Time over the network is both significant and can take up 75% of the total response time. To eliminate that time, ideally, load generators would be next to web servers. That would enable accurate diagnosis of response times purely on the server (and underlying services).
On AWS, an “affinity group” setting became available in 2018 to keep a set of servers close to each other, to minimize latancy of communication between servers.
One advantage of using a cloud vendor is that they make it easier to distribute traffic across several data centers so that if one center is hit by a disaster, a stand-by center can take over. Amazon calls them different “Availability Zones”. Amazon makes two or more “AZ’s” available for each of several dozen “Regions” around the world.
But does that really work and how much time does it take to switch between availability zones? That’s the job of “fail-over tests”.*
The redundancy of hosting and syncing data across several regions is more complex and costly than hosting across several Availability Zones.
Hosting across zones require use of multiple network VPC (Virtual Private Cloud) settings that define network security settings used.
TODO: Detailed comparison of various cloud vendor service names and offerings (Amazon, Azure, Google, Alibaba, etc.)?
References:
Based on the Deep Lizard’s AWS - Amazon Web Services EC2 Management video series from November 2017.
Load Balancing
When multiple server instances are involved, a Load Balancer is needed to balance (distribute) work among instances. Load Balancers can also use (X.509) SSL/TLS certificates installed to convert “https://” (port 443) encrypted requests to unencrypted “http://” (port 80) requests passed on to web servers. This reduces the decryption and encryption workload on individual servers on the back-end. But some prefer end-to-end security between all servers by generating and installing SSL certs in every server instance.
Some load balancers (such as F5) are specialized hardware (with ASIC chips) to process faster than standard computers. F5 itself, NGINX, Cisco, and others also have software-based load balancers which can be used instead of AWS offerings.
To duplicate a running production instance containing the latest version of all data, first setup EC2 instances to save incremental data snapshots into S3 (for Disaster Recovery). But a volumn in running instance should be briefly stopped and flushed of data before doing snapshots.
PROTIP: Each Elastic Load Balancer (ELB) and EC2 Auto Scaling Group (ASG) keeps its own set of logs to S3 objects. The default is only EC2 status checks. So set S3 bucket Properties > Logging of “aws-bucket-logging” to “enabled”.

PROTIP: BTW, for higher security, accounts writing logs to S3 buckets are set to write-only, with separate accounts to transfer, read-only, and delete.
AWS can keep a time-series ELB Access Logs of requests processed by a Load Balancer, which saves response latencies along with time of occurance, client IP address, request paths, and server responses. But they need to be activated at intervals of either 5 or 60 minutes.
To determine whether each instance within an ASG is “OutOfService” and need to be replaced, listeners periodically checks the health of each instance. The frequency between “pings” is set by the “Grace Period” (such as 300 seconds).*
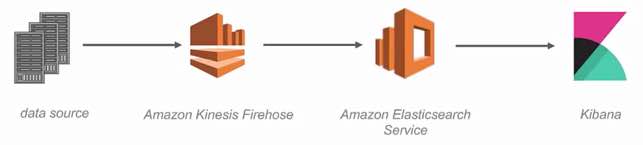
Log Analytics Visualization
PROTIP: AWS does NOT provide an UI to process and present analytics visualization to the logs it stores in S3. So filtering and analytics visualization are done using additional tools:
- Amazon Elasticsearch Service & Kinesis Mar 29, 2017 rather overkill with replicas
-
Amazon CloudWatch Logs Insights (DEV375) at AWS re:Invent 2018 Nov 29
-
AWS Elastic Map Reduce
-
Logz.io

- Splunk has its custom query language
SQL queries for ELB Logs filters for response codes that are not 200, the time frame of calls, etc.
Trends identified would include the time between acceptance of a connection to the first byte sent to an instance. Timings includes processing of a public key to match the one in the ELB setup with a back-end instance authentication policy.
Bastion Hosts
BTW, when servers behind a firewall use unencrypted traffic, they should not have connection to the public internet. But to obtain files from the open internet, traditionally, a “Bastion host” is setup for administrators (on pre-defined IP addresses). Such a server is the only one that goes through a NAT (Network Address Translation) “Gateway” which hides IP addresses from the outside world.
Once vetted, files needed by application servers are obtained from an internal Network File Share (NFS) or file respository server managed by utility software such as Nexus or Artifactory.
Bation hosts and inbound ports and SSH keys can be replaced by the AWS Systems Manager Session Manager, which also maintains an audit trail. But its IAM setup is tricky.*
A/B Testing
Cloud-based DNS (Domain Name Service) servers (within Amazon’s Route 53 service) resolves IP addresses from host names. It can also allocate a percentage of traffic to different sets of servers for Blue/Green Deployment or A/B testing. Blue/Green Deployment is used to transition users to a new set of an app environment for a new version. A/B testing allocates varying percentage of users to variations of an app to compare user reaction/satisfaction.
Instead of directly interacting with Route 53, the switchover can be specified in OpsWorks and Elastic Beanstalk consoles or via Cloud Formation templates This
A/B testing differs from “Blue-Green Deployments” in that several versions of a complete set of services are employed during A/B testing. But only one set of services are being used at a time when switching between Blue and Green Deployments.
Automation options
The advice here is to run cloud using automated scripts so that commands such as the above can be inserted when needed.
AWS has its CloudFormation YAML declarative specifications are “configuration as code”, stored in a version control repository such as GitHub, which enables fall-back to the complete set of files at various points back in time. Puppet then puts instances into a specific state.
HashiCorp’s Terraform equivalent HCL (which adds comments to YAML) is “multi-cloud” (stands up instances in AWS, Azure, GCP, etc.).
There are some differences in settings during testing vs. during production. For example, production Auto-Scaling Termination Policies would use “ClosestToNextInstanceHour” to save some money for Windows instances which are charged by the hour rather than Linux instances which are charged by the minute. But when testing a new launch configuration, it may be easier to terminate “NewestInstance” first.
Also to enable multi-cloud capability, some companies put their public-facing load balancers in their own data centers, then route to the cloud of their choice. QUESTION: How much latency does that introduce?
TODO: Complete this article:
AWS Elastic Beanstalk to deploy apps
Instance limits.
AWS Lightsail
In 2018 Amazon introduced its Lightsail service, which automatically scales EC2 instances running executables without the need to setup VPCs and auto-scaling groups. And rates are comparable to public hosting companies (starting at $5 per month).
Each Lightsale plan has a limit beyond which additional storage and data transfer costs would be incurred.
Among Linux Academy’s diagrams
TODO: Serverless
Istio and Envoy for Tracing
See https://wilsonmar.github.io/service-mesh
Recap of tasks
Here is a list of tasks mentioned above, in usual sequence of execution:
-
programmers ensure that their code does not run too long or take too much memory.
-
Scalability tests: Does running two smaller servers processes more transactions than a big server with the equivalent memory of two smaller servers.
-
What yields the highest rate of business transactions at the least total cost?
-
How quickly additional capacity is added after a request.
References
- An Introduction to Load Testing September 12, 2017
Project Management Life Cycle (PMLC)
Pluralsight videos
https://app.pluralsight.com/paths/certificate/microsoft-azure-architect-design-az-301
Pluralsight video course “Gathering Non-functional Requirements for Microsoft Azure by Harry Mumford Turner (@mumf_, harrymt.com) covers
- Stakehold priorities
- performance anti-patterns: busy database, front-end, chatty I/O, extraneous fetching
- Availability
- Security
- Capacity Planning and Scalability
- Maintainability
- Accessibility
- Deployability
- Extensibility
- Governance
- Quality
Optimizing Consumption Strategy in Microsoft Azure</s> Sept 13, 2018 [2h 53m] by James Bannan
Designing a Monitoring Strategy for a Solution in Microsoft Azure Nov 28, 2018 [3h 19m] by Brian Harrison
Wait, there’s more. Click one of these …
This article is one of a series about tuning and performance:
- Performance testing in the cloud era
- Perftest (Performance Testing and Engineering)
- Agile Performance Testing and Engineering
- Build load-balanced servers in AWS EC2 using CloudFormation
- JMeter in the cloud for distributed performance testing
- TruWeb performance testing on macOS and Linux clients
- JavaScript in LoadRunner
- LoadRunner Javascript coding
- LoadRunner 12.55 installation
- WebTours configuration in LoadRunner and others