
Indexing and visualization of logs, metrics, and other data - with AI
![]()
![]()
![]()
![]()
![]()
![]()
![]()
![]()
![]()
![]()
![]()
![]()
![]()
Overview
- Cisco Acquisition
- Splunk’s host names
- The company Splunk
- Splunk’s Value-Added
- Product Names
- Use cases
- Splunk SOAR
- SOAR (Security Orchestration and Automation)
- SOC Implementation Phases
- Different Proprietary Editions
- Use Splunk SaaS cloud using just a browser
- Install Splunk locally
- Terraform to install Splunk server
- Architecture
- Fundamentals Curriculum
- Dashboards
- Splunk Fundamentals Course
- BOTS database
- SPL (Search Processing Language)
- Functions (Critical commands)
- Reports
- SOC (Security Operations Center)
- Incidents
- Analysis Tools
- OReilly trainings
- Tutorials
- Architecture
- Configuration
- Add-ons
- Ingestion (Fishbucket) to avoid duplicate indexing
- Forwarder
- To troublesheet Splunk performance issues
- Search terms
- Book
- REST API
- Blazemeter
- Splunk certifications
- Competitors
- Video tutorials
- References
- Social
- References
- Hot buckets
- Boss of the SOC
- References
- More on Security
Cisco Acquisition
On Sep 21, 2023, Cisco announced it will acquire Splunk for $28 billion in cash and stock. The deal is expected to close in the second half of 2024.
- 75% of Splunk employees would recommend to a friend, according to surveys by Glassdoor, versus
89% of Cisco employees (which is among the top 5% of all US companies). So that’s positive news for employees.
Splunk’s host names
-
https://splunk.com is Splunk’s marketing page
-
https://splunk.com/blogs
- https://splk.it/ is Splunk’s URL shortener
- https://splk.it/SplunkCloudServDesc
-
https://docs.splunk.com/Documentation
-
https://bots.splunk.com for hands-on experiences using Splunk security products.
-
https://splunkbase.splunk.com for downloading files
-
https://github.com/splunk contains open source repos
- https://github.com/StudyClubForSplunk/ is referenced in
-
https://splunk.studyclub.community/ by volunteer helpers. Its leaders wear fez hats at Splunk conferences
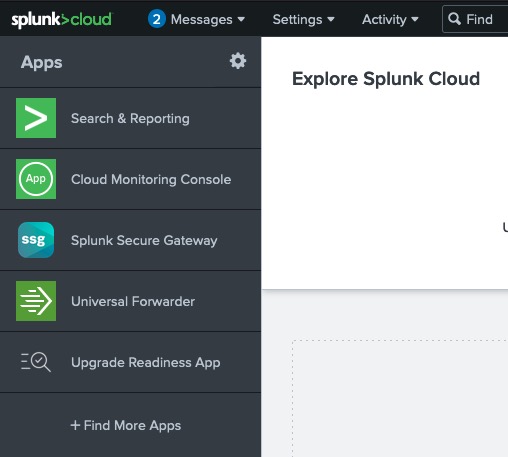
- Cloud Monitoring Console (CMC) is used by administrators to view Splunk system usage and health.
https://testsafebrowsing.appspot.com/ provides simulated attacks on browsers.
https://darkweb.sh/curriculum/
NOTE: Content here are my personal opinions, and not intended to represent any employer (past or present). “PROTIP:” here highlight information I haven’t seen elsewhere on the internet because it is hard-won, little-know but significant facts based on my personal research and experience.
The company Splunk
Splunk was founded in 2003 by Michael Baum, Rob Das, and Erik Swan.
The company mascot is called “Buttercup”.
People who work in the company Splunk are called “Splunkers”. https://www.wikiwand.com/en/Splunk notes that according to Glassdoor, it was the fourth highest-paying company for employees in the United States in April 2017.
Splunk, Inc. is headquartered at 270 Brannan St, San Francisco, California 94107. +1 415.848-8400.
It IPO’d in 2012 as ticker SPLK.
In 2020, Splunk was named to the Fortune 1000 list.
As of September 2020, Splunk’s client list includes 92 companies on the Fortune 100 list.[34]
Splunk’s Value-Added
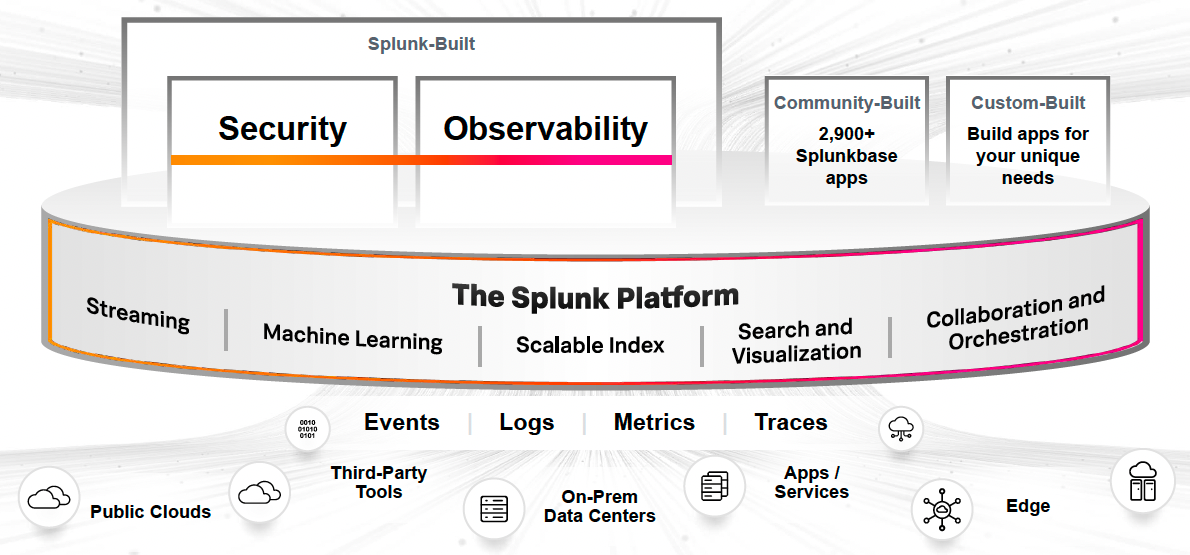
PROTIP: Although each cloud vendor has services that also do what Splunk does, many choose Splunk to avoid cloud vendor lock-in while going multi-cloud.
Splunk is like “Google” for machine-generated data, especially logs from servers, applications, and networks.
Splunk is now firmly entrenched in many data centers because Splunk works on almost all technologies to handle high volume, high variety data generated at high velocity.
Splunk is a software utility for machine log data collection, indexing, and visualization for “operational intelligence”. Splunk can ingest almost all technologies (on-prem, clouds, databases, etc.) for use by SOC (Security Operations Centers) who correlate what’s going on across the vast landscape of technologies.
-
Collect and Index Log Data: Index streaming log data from all your distributed systems regardless of format or location.
-
Visualize Trends
-
Zoom in and out on timelines to automatically reveal trends, spikes and patterns and click to drill down into search results.
-
Issue alerts (based on AIOps)
On June 11, 2018, Splunk announced its acquisition of VictorOps, a DevOps incident management startup, for US$120 million. The VictorOps product is renamed to “Splunk Online”.
In October 2019, Splunk announced the integration of its security tools - including security information and event management (SIEM), user behavior analytics (UBA), and security orchestration, automation, and response (Splunk Phantom) — into the new Splunk Mission Control.
In 2019, Splunk introduced an application performance monitoring (APM) platform, SignalFx Microservices APM, that pairs “no-sample” monitoring and analysis features with Omnition’s full-fidelity tracing capabilities. Splunk also announced that a capability called Kubernetes Navigator would be available through their product, SignalFx Infrastructure Monitoring.
Also in 2019, Splunk announced new Data Fabric Search and Data Stream Processor. Data Fabric Search that combines into a single view datasets across different data stores, including those that are not Splunk-based. The required data structure is only created when a query is run. The real-time Data Stream Processor collects data from various sources and then distributes results to Splunk or other destinations. It allows role-based access to create alerts and reports based on data that is relevant for each individual.[61] In 2020, it was updated to allow it to access, process, and route real-time data from multiple cloud services.[62]
Also in 2019, Splunk rolled out Splunk Connected Experiences, which extends its data processing and analytics capabilities to augmented reality (AR), mobile devices, and mobile applications.
In 2020, Splunk announced Splunk Enterprise 8.1 and the Splunk Cloud edition. They include stream processing, machine learning, and multi-cloud capabilities.
https://www.glassdoor.com/Reviews/Splunk-Reviews-E117313.htm at time of writing, 77% of employee responders would recommend to a friend, which is “Good” (based on 1,000+ reviews).
Product Names
“Splunk can be used for ALL your data needs.” It is a data platform. It is a data lake. It is a data warehouse. It is a data lakehouse. ;)
Splunk offers proprietary products:
- Splunk Application Performance Monitoring (APM)
- Splunk Cloud Platform
- Splunk Connected Experiences (Mobile, AR, VR, TV)
- Splunk Data Stream Processor
- Splunk Edge Hub
- Splunk Enterprise
- Splunk Enterprise Security
- Splunk Incident Intelligence
- Splunk Infrastructure Monitoring
- Splunk IT Service Intelligence
- Splunk Machine Learning Toolkit
- Splunk Mission Control
- Splunk Observability Cloud
- Splunk On-Call (formerly VictorOps)
- Splunk Real User Monitoring (RUM)
- Splunk Security, Orchestration, Automation and Response (SOAR)
- Splunk Synthetic Monitoring
- Splunk Threat Intelligence Management
- Splunk User Behavior Analytics
- Splunk Web Optimization
- OpenTelemetry
Use cases
On the marketing website:
- SOC Automation & Orchestration
- Advanced threat detection
- Application modernization
- Extend visibility to the cloud (modernization)
- Incident Investigation & Forensics
- Isolate Cloud Native Problems
The full list also has:
- SLI/SLO Monitoring - centralize performance tracking visualizations and smart alerting to better manage cloud KPIs across environments.
Splunk SOAR
https://splunk.com/soar for free trial (100 trans/day)
Splunk “Mission Control” presents Analytics and Case Management to unify SIEM and SOAR.
Verizon DBIR 2022 found # of incidents going down but breaches going up.
d3fend.mitre.org (MITRE D3FEND) is the response to MITRE ATT&CK. detonate files, quarantine hosts, disable users, revoke tokens. – Peter Kaloroumakis, D3FEND Lead. Techniques to Playbooks (step-by-step) Splunk Enrichment Response Packs of an Analytics Story for Response.
https://research.splunk.com/playbooks
https://research.splunk.com/playbook explorer
Transparent Huge Pages (THP)
TAs
TAs (Technical Apps) extend the functionality of Splunk.
C# and Python make calls to Splunk’s APIs.
Splunk’s UCC (Universal Configuration Console)
pip install splunk-packaging-toolkit ucc-gen –help
SOAR (Security Orchestration and Automation)
Splunk SOAR (Security Orchestration and Automation) is a cloud-based platform that automates security tasks, orchestrates workflows, and reduces incident response time.
It reduces “alert fatigue” by automating the triage and remediation of security alerts, and automating the response to security incidents.
The hype:
- Investigate and respond to threats faster
- Increase SOC efficiency and productivity
- Eliminate analyst grunt work so you can stop working hard and start working smarter
- Go from overwhelmed to in-control of your security operations
Splunk SOAR’s Main Dashboard provides a “single pane of glass”, with an overview of all analyst data and activity, notable events, playbooks, connections with other security tools, workloads, ROI, and more.
Splunk offers a free Community Edition of SOAR (to automate tasks, orchestrate workflows, and reduce incident response time). Fill out a form for their approval before allowing you to download:
https://my.phantom.us/signup/
- NOTE: "Phantom" was the previous name for the SOAR (cloud) product.
NOTE: Splunk SOAR (Cloud) does not allow access from the Splunk Connected Experiences mobile apps.
Splunk SOAR (Cloud) supports SAML2 authentication.
SOAR marketing page references:
- https://www.splunk.com/en_us/products/splunk-security-orchestration-and-automation.html
- https://www.splunk.com/en_us/software/splunk-security-orchestration-and-automation.html
- https://www.splunk.com/en_us/data-insider/what-is-soar.html
- https://www.splunk.com/en_us/blog/security/soaring-to-the-clouds-with-splunk-soar.html
- https://docs.splunk.com/Documentation/SOAR/current/ServiceDescription/SplunkSOARService
SOAR Playbooks
- VIDEO: https://www.splunk.com/en_us/software/splunk-security-orchestration-and-automation/features.html
By defining and automating the sequence of actions, SOAR playbooks enable swifter responses to triggers, thus reducing incident response time.
It pulls in data from SIEM, EDR, firewall, and threat intelligence feeds.
Post-incident, SOAR playbooks automate remediation of the attack and case management.
SOAR automates tasks, orchestrate workflows:
-
Splunk SOAR comes with 100+ pre-made playbooks out of the box.
-
Users can build and edit playbooks in the original horizontal visual playbook editor or the vertical visual playbook editor introduced August 2021.
-
Splunk SOAR (Cloud) is provisioned with 600GB of disk space and 600GB of PostgreSQL database storage.
SOAR Enrichments
SOAR uses Splunk Intelligence Management (formerly TruSTAR) normalized indicator enrichment, captured within the notes of a container. It enables an analyst to view details and specify subsequent actions directly within a single Splunk SOAR prompt for rapid manual response.
The “Suspicious Email Domain Enrichment” playbook uses Cisco Umbrella Investigate to add to the security event in Spunk SOAR a risk score, risk status, and domain category. This enables faster recognition of the purpose of the email, and the domain enrichment will also provide a connection point to take further action on the output.
SOC Implementation Phases
with CMM (Capability Maturity Model)
- Define scope at CCM Level 1 (Ad Hoc State) - Processes are unpredictable and inconsistent.
- Implement Technologies
- Hire and Build Team
- Develop Policies, Processes, Procedures to reach CCM Level 2 (Repeatable State)
- Reach CCM Level 3 (Initial - Managed - Defined State)
- Develop KPI (Quantitative) and KRI (Qualitative) Metrics
- Automate to reach CCM Level 4 (Optimizing State)
Different Proprietary Editions
Not available in free versions:
- Authentication
- Distributed search. Scheduled searches and alerting
- Forwarding in TCP/HTTP (to non-Splunk)
- Deployment management
PROTIP: A free Splunk Enterprise license allows indexing of up to 500MB per day for 60 days. After that, convert to a perpetual Free license or purchase an Enterprise license.
The master pool quota aggregates a license pools for each index/source type, with its own sub-quota.
./splunk is “short-hand” for the splunk executable in $SPLUNK_HOME/bin/splunk
- On Unix, this is by default /opt/splunk/bin/splunk
- On Windows it is c:\program files\splunk\bin\splunk
- On MacOS it is /Applications/splunk/bin/splunk
Use Splunk SaaS cloud using just a browser
There is a different set of installation and set-up instructions depending on the edition.
-
14-day Splunk Cloud Platform Trial:
https://www.splunk.com/en_us/download/splunk-cloud.html
-
60-day @ 500MB/day Splunk Enterprise Trial on a server:
https://www.splunk.com/en_us/download/splunk-enterprise.html
Support for MacOS was deprecated since Slunk Enterprise versions 10.14 or 10.15.
-
6 months @ 50 GB/day Dev/Test for customers with an enterprise support license.
Install Splunk locally
-
Go to the Download page:
- Fill out the form.
- Open “Confirm your email address” email and click the link.
- At https://www.splunk.com/en_us/download/splunk-cloud/cloud-trial.html
- Wait for email “Welcome to Splunk Cloud Platform!” providing
- Splunk Cloud Platform URL: https://prd-c-xxxx.splunkcloud.com
- User Name: sc_admin
- Temporary Password: xxxxxxxx
- Login to Splunk Cloud Platform at https://prd-c-xxxx.splunkcloud.com
- Copy and paste the temporary password into the password field.
- Create a new password and save it in a secure location.
- Accept terms.
- Read what’s new
- In the menu, notice the “prd-…” in the URL to the Search Manual, Pivot Manual, Dashboard & Visualizations Manual
- “Take the free Splunk Fundamentals course” at https://www.splunk.com/en_us/training/free-courses.html A. What is Splunk (45 min) B. Intro to Splunk C. Using Fields
Terraform to install Splunk server
To manage your Splunk infrastructure as code using Terraform:
Created Septermber 2020, https://registry.terraform.io/providers/splunk/splunk/latest at https://github.com/splunk/terraform-provider-splunk
Architecture
Fundamentally
- INPUT
- PARSING
- INDEXING
Fundamentals Curriculum
Splunk has 160 commands. eval are the most important.
- Search & Reporting
- Dashboards
- Alerts
- Apps
- Settings
- Help
Dashboards
- Use the Safari browser to download
- tutorialdata.zip
- Prices.csv.zip Do not unzip them because Splunk unzips automatically when you install the app.
PDF: Dashboards and Visualizations Manual
Two different visualization frameworks:
-
The Classic Splunk dashboards and visualizations framework uses Simple XML as the source code and has a limited user interface.
-
The Splunk Dashboard Studio framework uses JSON-formatted stanzas as the source code for the objects in a dashboard, and for the entire dashboard. Add visualizations directly to a dashboard and wire them to searches (aka data sources), without entering the source editor or using Search & Reporting. No Trellis & 3rd party visualizations. Adds Choropleth SVG images.
Splunk Fundamentals Course
Module 1 – Introduction
- Overview of Buttercup Games Inc. since 2016: fake company with a real game to go splunking through a cave dodging stalactites and stalagmites.
Module 2 – What is Splunk?
- Splunk components
- Installing Splunk
- Getting data into Splunk
Module 3 – Introduction to Splunk’s User Interface
- Understand the uses of Splunk
- Define Splunk Apps
- Customizing your user settings
- Learn basic navigation in Splunk
Module 4 – Basic Searching
- Run basic searches
- Use autocomplete to help build a search
- Set the time range of a search
- Identify the contents of search results
- Refine searches
- Use the timeline
- Work with events
- Control a search job
- Save search results
Module 5 – Using Fields in Searches
- Understand fields
- Use fields in searches
- Use the fields sidebar
Module 6 – Search Language Fundamentals
- Review basic search commands and general search practices
- Examine the search pipeline
- Specify indexes in searches
- Use autocomplete and syntax highlighting
- Use the following commands to perform searches:
o tables
o rename
o fields
o dedup
o sort
Module 7 – Using Basic Transforming Commands
- The top command
- The rare command
- The stats command
Module 8 – Creating Reports and Dashboards
- Save a search as a report
- Edit reports
- Create reports that include visualizations such as charts and tables
- Create a dashboard
- Add a report to a dashboard
- Edit a dashboard
Module 9 – Datasets and the Common Information Model
- Naming conventions
- What are datasets?
- What is the Common Information Model (CMI)?
Module 10 – Creating and Using Lookups
- Describe lookups
- Create a lookup file and create a lookup definition
- Configure an automatic lookup
Module 11 – Creating Scheduled Reports and Alerts
- Describe scheduled reports
- Configure scheduled reports
- Describe alerts
- Create alerts
- View fired alerts
Module 12 - Using Pivot tables and charts with SPL
- Describe Pivot
- Understand the relationship between data models and pivot
- Select a data model object
- Create a pivot report
- Create an instant pivot from a search
- Add a pivot report to a dashboard
The Pivot tool is a drag-and-drop UI that lets you report on Datasets without the Splunk Search Processing Language (SPL™).
Each dataset exists within a data model, which defines a subset of the dataset represented by the data model as a whole. Each data model consists of one or more data model datasets.
Data model datasets have a hierarchical relationship with each other (have parent-child relationships). Data models can contain multiple dataset hierarchies.
Child datasets have inheritance. Data model datasets are defined by characteristics that mostly break down into constraints and fields. Child datasets inherit constraints and fields from their parent datasets and have additional constraints and fields of their own.
The types of dataset hierarchies: event, search, transaction, child:
- Event datasets represent a set of events. Root event datasets are defined by constraints (see below). *Transaction datasets represent transactions–groups of events that are related in some way, such as events related to a firewall intrusion incident, or the online reservation of a hotel room by a single customer.
- Search datasets represent the results of an arbitrary search. Search datasets are typically defined by searches that use transforming or streaming commands to return results in table format, and they contain the results of those searches.
- Child datasets can be added to any dataset. They represent a subset of the dataset encompassed by their parent dataset. You may want to base a pivot on a child dataset because it represents a specific chunk of data–exactly the chunk you need to work with for a particular report.
See https://docs.splunk.com/Documentation/Splunk/9.0.4/Knowledge/Aboutdatamodels
BOTS database
logs and use cases
https://github.com/splunk/botsv3
NOTE: Infographics published by FinancesOnline (https://financesonline.com) indicated that humans created, captured, copied, and consumed about 74 zettabytes of data in 2021. That number is estimated to grow to 149 zettabytes in 2024.
SPL (Search Processing Language)
SPL2 also handles ANSI SQL.
Search interface, Anatomy of a Search Logical expressions Using Pipe Using fields
Functions (Critical commands)
- stats functions
- eval
- eventstats and streamstats
- timechart
Reports
Tasks:
- Create and manage reports, dashboards
- Schedule a report
- Schedule a dashboard for PDF delivery
Technology reports:
- Malware Summary: No. of Infections, Hosts infected, Users, Malware Type/Name, Action by AV, Files
- Firewall Summary: Inbound/Outbound, Source/Destination, Protocol, Action, Bytes, Packets
- Account Management Summary: Account Creation, Account Modification, Account Deletion, Lockouts, Password Resets
- Authentication Summary: Successful/Failed logins, logouts, Account Logons/Lockouts
- Proxy Summary: Top 10: users, URLs, domains, IP addresses, Malware, Malicious URLs, Malicious domains, Malicious IP addresses, Malicious/Normal downloads and Action
- Email Summary: Top 10: senders, Recipients, Sender domains, IP addresses, Mail blocking reasons, Malicious/Normal downloads and Action
- Threat Intelligence Summary: Inbound/Outbound, Source/Destination, Protocol, Action, Bytes, Packets
SIEM Performance reports:
- SIEM Performance Summary
- SIEM Performance Summary by Source
- SIEM Performance Summary by Destination
- SIEM Performance Summary by Source and Destination
SOC (Security Operations Center)
Security Models: In-house, MSSP (Managed Security Service Provider)/MSP (Managed Service Provider): Dedicated or Shared.
A SOC team correlates and analyzes security events from multiple sources, including network traffic.
From Infosec Institute What does a SOC analyst do?
- Security operations center (SOC) analysts are responsible for analyzing and monitoring network traffic, threats and vulnerabilities within an organization’s IT infrastructure. This includes monitoring, investigating and reporting security events and incidents from security information and event management (SIEM) systems. SOC analysts also monitor firewall, email, web and DNS logs to identify and mitigate intrusion attempts.
- Threat Intelligence, Threat Hunter, Forensic Investigator,
- Incident Handler
- Incident Response Automation Engineer
- Red Team Specialist, Lead
- SOC Engineer, Manager
Incident Response Process
NIST SP 800-61 & SANS (SysAdmin, Audit, Network, Security) Institute’s Incident Response Process:
- Preparation
- Identification
- Containment
- Eradication
- Recovery
- Lessons Learned
Metrics of activity:
- No. of Log Sources: 2,800 - 3,000
- No. of Log Events/day: 100,000 - 1,000,000
- No. of Alerts/day: 100 - 200
- No. of incidents/day: 2 - 5
SLA
SLA: time to identify and report suspicious activity:
- P1: up to 30 minutes
- P2: 1 hour
- P3: 2 hours
- P4: 4 hours
SOC Analyst Interview Q&A, from https://www.socexperts.com
https://www.youtube.com/watch?v=AtRTliJ4Fe0 The Roles and Responsibilities of a Security Operations Center (SOC) by Mike Worth
https://www.youtube.com/watch?v=YVQriOVHl18 A TYPICAL Day in the LIFE of a SOC Analyst
Incidents
Ticketing tools: Service Now (SNOW), Jira, BMC Remedy, RSA Archer
- Reported By
- Incident ID assigned by ticketing tool
- Detected Time
- Incident Description/Details
- Assigned To
- Occurred Time
- Incident Name (Summary)
- Priority
- Severity
- What’s Affected: systems, hosts, IP addresses, User, Business unit, etc.
- Evidence
- Analysis
- Status
- Resolution Date
Analysis Tools
- VirusTotal.com
- IPVOID
- Wireshark
- MXToolBox
- CVE Details
- US-CERT
- IBM X-Force/Threat Crowd
Process Explorer
tools4noobs.com
OReilly trainings
https://learning.oreilly.com/live-events/beginning-splunk/0636920372424/ Video course: Beginning Splunk
Tutorials
Fundamentals courses are FREE at https://education.splunk.com/catalog?category=splunk-fundamentals-part-1
https://www.javatpoint.com/splunk text tutorial
VIDEO: Explaining Splunk Architecture Basics
Other downloads:
NOTE: Index 500 MB/Day.
-
Previously: to download:
wget -O splunk-7.1.0-2e75b3406c5b-darwin-64.tgz 'https://www.splunk.com/bin/splunk/DownloadActivityServlet?architecture=x86&platform=macos&version=7.1.0&product=splunk&filename=splunk-7.1.0-2e75b3406c5b-darwin-64.tgz&wget=true'
The MD5 is at, for the version at time of writing: https://download.splunk.com/products/splunk/releases/7.1.0/osx/splunk-7.1.0-2e75b3406c5b-darwin-64.tgz.md5
-
If you don’t have an account, register.
-
You may have to copy and paste the URL from above to get back to the page.
-
https://www.splunk.com/en_us/training/videos/all-videos.html
-
http://docs.splunk.com/Documentation/Splunk/latest/Installation
-
https://www.splunk.com/pdfs/solution-guides/splunk-quick-reference-guide.pdf
-
For release notes, refer to the Known issues in the Release Notes manual:
- http://docs.splunk.com/Documentation/Splunk/latest/ReleaseNotes/Knownissues
- http://docs.splunk.com/Documentation/SplunkCloud/6.6.0/SearchReference/Commandsbycategory
Architecture
Splunk offers ingestion in streaming mode (not batch).
Splunk stores data in indexes organized in directories and files.
Splunk compresses data in flat files using their own proprietary format which are read by SPL (Splunk Processing Language).
Splunk apps have a preconfigured visual app UI.
Splunk add-ons do not have a preconfigured visual UI app (headless).
Configuration
Splunk default configurations are stored at $splunkhome/etc/system/default
-
To disable Splunk Launch Messages in splunk_launch.conf
OFFENSIVE=Less
Components, Licenses, Default Ports
Splunk licenses charge by how much data can be indexed per calendar day (midnight to midnight).
Deployment Server manages Splunk components in a distributed environment.
Each Cluster Member for index replication is licensed.
Each forwarder forwards logs to the Splunk Indexer:
- Universal Forwarder (UF)
-
Heavyweight Forwarder (HWF) parses data (so not recommended for production systems)
-
8000 - Splunk web port - the Search Head providing GUI for distributed searching
- Search head cluster is more reliable and efficient than (older) search head pooling (to be deprecated).
- Search head cluster is managed by a captain, which controls its slaves (legacy terminology)
- 8080 - Splunk Index Replication port by the Indexer
-
8089 - Splunk Management GUI port
https://yoursplunkhost:8089/services/admin/inputstatus
-
8191 - Splunk KV Store
- 9997 - Splunk Indexing port
- 514 - Splunk Network port
Add-ons
https://splunkbase.splunk.com/app/3138/ 3D Scatterplot - Custom Visualization is built with plotly.js, which combines WebGL and d3.js. So you can zoom, rotate, and orbit around the points, change aspect ratios, colors, sizes, opacity, labels, etc.
Currently, this visualization supports 50,000 points and does not limit your categorical values. Download the app to see some examples.
-
Disalbe Start the daemon:
$SPLUNK_HOME/bin/splunk disable boot-start
-
boot Start the daemon:
$SPLUNK_HOME/bin/splunk enable boot-start
-
Start
splunk start splunkweb
Start daemon:
splunk start splunkd
-
Verify process started (by name):
ps aux | grep splunk
To reset admin password (v7.1+):
-
stop Splunk process.
-
Find the passwd file and rename it “passwd.bk”.
- In directory: $SPLUNK_HOME/etc/system/local
-
Create file user-seed.conf containing:
[user_info]
PASSWORD = NEW_PASSWORD
-
Create file ui-prefs.conf containing this to have all search app users see : today
[search]
dispatch_earliest_time = @d
dispatch_latest_time = now
- Start the server.
Precedence:
-
system local directory have highest priority
- App local directories
- App default directories
- System default directory have lowest priority
Sample data (up to 500 MB) can be obtained free from Kaggle, such as Titanic passengers. See https://www.javatpoint.com/splunk-data-ingestion
Ingestion (Fishbucket) to avoid duplicate indexing
To prevent splunk from re-ingesting files it’s already processed (such as a directory full of logs).
Access them through the GUI by searching for:
index=_thefishbucket
Splunk UFs & HFs track what files it’s ingested - via monitor, batch, or oneshot - through an internal index called the fishbucket in default folder:
- /opt/splunk/var/lib/splunk
That folder contains seek pointers and CRCs for files being indexed, for splunkd to tell whether each has been read.
The fishbucket index contains pairs of file paths & checksums of ingested files, as well as some metadata.
It also prevents re-ingestion if a first ingestion has somehow gone wrong (wrong index, wrong parsing, etc.).
-
To bypass this limitation, it is possible to delete the entire fishbucket off the filesystem. But this is very much less than ideal - it may cause other files to be re-ingested. Instead, there is a ‘clean’ command that can excise the record of a particular file. Run this while logged in as the splunk user:
splunk cmd btprobe -d $SPLUNK_HOME/var/lib/splunk/fishbucket/splunk_private_db --file /path/to/file.log --reset
-
After removal, re-ingest the file:
splunk add oneshot -source /path/to/file.log -sourcetype ST -index IDX -host HOSTNAME
The most common use case for this is testing index-time props/transforms - date/time extraction, line-breaking, etc. Using a sample log, ingest the file, check the parsing logic via search, then either fix the props and clean & reingest as necessary, or continue onboarding normally.
https://docs.splunk.com/Documentation/AddOns/released/Linux/Configure collectd_html format
Forwarder
http://docs.splunk.com/Documentation/Splunk/6.2.5/Data/Setupcustominputs
Splunk places indexed data in buckets (physical directories) each containing events of a specific period.
Over time, each bucket changes stages as it ages:
- One or more buckets are hot when newly indexed and open for writing.
- Warm buckets contain data rolled out of hot buckets
- Cold buckets contain data rolled out of warm buckets
- Frozen buckets contain data from cold buckets. They are not searchable, and deleted (or archived) by the indexer
To troublesheet Splunk performance issues
-
Watch Splunk metrics log in real time:
index="_internal" source="metrics.log" group="per_sourcetype_thruput"
series="<your_sourcetype_here&T;"
eval MB=kb/1024 | chart sum(MB)
Alternately, watch everthing, split by source type:
index="_internal" source="metrics.log" group="per_sourcetype_thruput" | eval MB=kb/1024 | chart sum(MB) avg(eps) over series
-
Check splunkd.log for errors.
-
Check for server performance metrics (CPU, memory usage, disk I/O, etc.)
-
The SOS (Splunk on Splunk) app is installed to check for warnings and errors (on the dashboard)
-
Too many saved searches can consume excessive system resources.
-
Install and enable Firebug browser extension to reveal what happens when logging into Splunk. Then enable and switch to the “Net” panel to view time spent in HTTP requests and responses
-
use btool to troubleshoot configuration files.
Each search is recorded as a .csv of search results and a search.log in a folder within: $SPLUNK_HOME/var/run/splunk/dispatch
The waiting period before each dispatch directory is deleted is controlled by limits.conf.
If user requests saving, they are deleted after 7 days.
To add folder access logs:
- Enable Object Access Audit through group policy on the Windows machine on which the folder is located.
- Enable auditing on the specific folder for which logs are monitored.
- Install Splunk Universal Forwarder on the Windows machine.
- Configure Universal Forwarder to send security logs to Splunk Indexer.
Search terms
Ideally, stats commands are used when unique IDs are available for use because they have higher performance.
But sometimes the unique ID (from one or more fields) alone is not sufficient to discriminate among transactions, such as when web sessions are identified by a cookie/client IP. In that case, transaction commands reference raw text serving as message identifier may be used to begin and end transactions.
stats commands generate summary statistics of all existing fields in search results as values in new fields.
EventStats commands aggregates to original raw data when event stats
Regular Expressions
There are two ways to do Regular Expressions, such as extracting an IP address:
-
rex field = raw “(<ip_address>\d+.\d+.\d+.\d+)”
-
rex field = raw “(<ip_address>([0-9][{1,3}[.]){3}{0-9}{0,3})”
-
To disable search history, delete file:
$SPLUNK_HOME/var/log/splunk/searches.log
Map Reduce Alogorithm
The mechanism that enable Splunk’s fast data searching is that Splunk adapted the map() and reduce() alogorithms that functional programming uses for large-scale batch parallelization processing to streaming.
Book
Splunk Operational Intelligence Cookbook By Josh Diakun, Paul R Johnson, Derek Mock
Installs and Configures Splunk forwarders and servers
REST API
http://dev.splunk.com/restapi
https://github.com/cerner/cerner_splunk https://github.com/search?utf8=%E2%9C%93&q=splunk&type=
Blazemeter
Blazemeter has additional software that only works on their cloud platform.
Splunk certifications
Splunk Enterprise Security Certified Admin is among the most expensive of all certifications: $4,625.
Splunk Cloud Fundamentals 1
Splunk offers a free class called Fundamentals 1 to get people to get started in Splunk and get certified in Core User
Get FREE Access for one month at https://education.splunk.com/course/splunk-infrastructure-overview
https://docs.splunk.com/Documentation/Splunk/latest/Installation/Systemrequirements Splunk Web front-end runs on 8000 for modern browsers Splunk listens on port 8065 bound to loopback interface KV store uses port 8191 https://docs.splunk.com/Documentation/Splunk/latest/installation/RunSplunkasadifferentornon-rootuser In any directory (/opt/)
Splunk server components: all running splunkd written in C/C++ on SSL port 8089 for mgmt
- Forwarders on servers where data originates forwards data to Splunk indexers
- Indexers receive metrics to store in a Splunk index containing directories organized by age
- Search heads handles search request language on indexers, then consolidate results in reports and dashboards of visualizations Knowledge Objects extracts additional fields and transform data.
Each instance indexes less than 20GB per day for under 20 users using a small number of forwarders.
- Indexers: 2 64-bit CPU with 6x2GHz cores, 12GB RAM, 1GbE NIC, 800 IOPS
- Search heads: 4 64-bit CPU with 4x2GHz cores, 12GB RAM, 1GbE NIC, 2 x 10K RPM 300GB SAS drives - RAID-1
- Forwarders: 1 64-bit CPU with 2x1.5GHz cores, 1GB RAM
Supporting search head with 3 indexers up to 100GB per day up to 100 users using several hundred forwarders. Add 3 search heads under a search cluster to distribute requests.
An Index cluster replicates index data promotes availability and prevents data loss. https://docs.splunk.com/Documentation/Splunk/latest/installation/ChoosetheuserSplunkshouldrunas
Commands:
	./splunk help
	./splunk enable boot-start -user ubuntu
	./splunk start --accept-license
	./splunk stop
	./splunk restart
User: admin/changeme
Turn off transparent huge pages ?
Other components:
- License master
- Deployment server
- Cluster manager
Splunk scales instances: Input, Parsing, Indexing, Searching
Forwarder Management
- Introduction
- What is Splunk?
- Introduction to Splunk’s interface
- Basic searching
- Using fields in searches
- Search fundamentals
- Transforming commands
- Creating reports and dashboards
- Datasets
- The Common Information Model (CIM)
- Creating and using lookups
- Scheduled Reports
- Alerts
- Using Pivot
Competitors
Datadog SaaS.
Sumo Logic provides a paid alternative only as a public cloud-based service.
The ELK stack (ElasticSearch, LogStash for log gathering, and Kibana for visualization) provides both free on-premises and paid cloud offerings.
Loggly and LogLogic also.
For visualization there is also Graphite, Librato, and DataDog.
QRadar is a SIEM product from IBM. VIDEO
Video tutorials
https://www.tutorialspoint.com/splunk/index.htm
Installing and Configuring Splunk
Pluralsight video course: Optimizing Fields, Tags, and Event Types in Splunk [1h 36m] 28 Feb 2019 by Joe Abraham (@jobabrh, jobabrahamtech.com) is based on Splunk version 7.2.1
Performing Basic Splunk Searches
Analyzing Machine Data with Splunk
References
By Intellipaat:
-
Splunk Software Engineer Interview Questions and Answers | Splunk Security Interview Question
-
How Splunk Works | Log Monitoring Splunk | Splunk Architecture
By Kinney Group:
Gerald Auger, PhD - Simply Cyber YouTube channel references home lab build by Eric Capuano of Recon Infosec YouTube channel. Uses Lima Charlie for threat hunting.
Social
https://www.linkedin.com/company/splunk/
https://twitter.com/splunk #TurnDataIntoDoing
Splunk online documentation: http://docs.splunk.com/Documentation/Splunk
Splunkbase community: https://community.splunk.com
Splunk Community Slack (splk.it/slack)
Splunk User Groups (usergroups.splunk.com)
http://conf.splunk.com/ July 17-20, 2023 | Las Vegas https://twitter.com/hashtag/splunkconf23 $1,695
References
https://www.devopsschool.com/tutorial/splunk/labs/fundamental/SplunkFundamentals1_module4.pdf
SplunkTrust community
Hot buckets
Splunk puts data into buckets. Each bucket has a time span.
If there is an existing bucket defined for a time span that include the time of the data,
Splunk puts data into that bucket.
maxspansecs
How many buckets?
maxHotBuckets = 3 is the default, for 2 normal buckets are open at a time, plus a final bucket slot reserved for quarantined data.
QUESTION: Quarantined data?
Larger number of buckets for a high volume index or if there are regular delays in event delivery. The more hot buckets Splunk has open, the greater the time range to cover for events.
Splunk creates a new hot bucket if there is a slot available for a new hot bucket.
PROTIP: Bringing in old data (back in time) may give your buckets indigestion.
Buckets contain raw and tsidx data.
maxHotSpanSecs = 777600 default for 90 days. 3 maxHotBuckets would yield 240 days. Change if there are regularly larger than expected timespans. This can be overruled by Splunk.
minHotIdleSecsBeforeForceRoll = auto for Splunk to autotune (starting at 600 secs).
maxDatasize =
Normally, Splunk places the event in the bucket with the closest timestamp.
But if an event does not fit into an existing hot bucket, if there is at least one bucket idle long enough to be allowed to roll, Splunk closes the hot bucket with the longest idle time before creating a new hot bucket.
Boss of the SOC
https://github.com/splunk/botsv3/ contains a sample pre-index security dataset used in CTF (Capture The Flag) competitions. Its data SourceTypes include aws:cloudtrail, and many others. Required software include AWS Guard Duty, CiscoNVM, Code42 App for Splunk, and a Splunk Add-in for each cloud.
References
https://www.splunk.com/en_us/pdfs/resources/whitepaper/detecting-supply-chain-attacks.pdf Detecting Supply Chain Attacks Using Splunk and JA3/s hashes to detect malicious activity on critical servers
https://learning.oreilly.com/library/view/sams-teach-yourself/9780135182925/ SQL in 10 Minutes, 5th Edition, 2019, by Ben Forta:
https://learning.oreilly.com/library/view/unix-and-linux/9780134278308/ Unix and Linux System Administration Handbook, 5th Edition, by Evi Nemeth et al
More on Security
This is one of a series on Security in DevSecOps:
- Security actions for teamwork and SLSA
- Code Signing on macOS
- Git Signing
- GitHub Data Security
- Azure Security-focus Cloud Onramp
- AWS Onboarding
- AWS Security (certification exam)
- AWS IAM (Identity and Access Management)
- SIEM (Security Information and Event Management)
- Intrusion Detection Systems (Goolge/Palo Alto)
- SOC2
- FedRAMP
-
CAIQ (Consensus Assessment Initiative Questionnaire) by cloud vendors
- AKeyless cloud vault
- Hashicorp Vault
- Hashicorp Terraform
- SonarQube
- WebGoat known insecure PHP app and vulnerability scanners
- Security certifications
- Quantum Supremecy can break encryption in minutes
- Pen Testing
- Threat Modeling
- WebGoat (deliberately insecure Java app)