

Adds filters missing in GraphQL. Adds graphs missings in SQL. The one language to rule logs.
![]()
![]()
![]()
![]()
![]()
![]()
![]()
![]()
![]()
![]()
![]()
![]()
![]()
Overview
 Kusto is named after pioneering Oceanographer Jacque Custou (pronounced “Kusto”).
Like the language, he dove deep into a vast ocean for new insights.
Kusto is named after pioneering Oceanographer Jacque Custou (pronounced “Kusto”).
Like the language, he dove deep into a vast ocean for new insights.
NOTE: Content here are my personal opinions, and not intended to represent any employer (past or present). “PROTIP:” here highlight information I haven’t seen elsewhere on the internet because it is hard-won, little-know but significant facts based on my personal research and experience.
Compared to SQL, KQL is less verbose.
But KQL is proprietary to Microsoft.
KQL is used in several Azure products, including Microsoft’s Azure Data Explorer (ADX) offering. The ADX managed SaaS service (GA 2019) for big data exploration in NRT (Near Real Time).
Log Analytics is a tool in the Azure portal to edit and run log queries from data collected by Azure Monitor logs – to interactively analyze their results. Use Log Analytics queries to retrieve records that match particular criteria, identify trends, analyze patterns, and provide various insights into your data.
This example of a KQL query draws data from the Heartbeat dataset. rendered as a timechart:

REMEMBER: The KQL language is read-only (does not update data). There is a limit of 5 GB in KQL queries.
Tutorials
On Microsoft Learn (for XP points): text-based:
-
https://docs.microsoft.com/en-us/sharepoint/dev/general-development/keyword-query-language-kql-syntax-reference
-
This article on KQL is one of Neeraj Kumar’s excellent series on data science using Azure.
-
https://learn.microsoft.com/en-us/training/paths/analyze-monitoring-data-with-kql/
-
https://docs.microsoft.com/en-us/azure/data-explorer/kusto/query/
-
https://docs.microsoft.com/en-us/azure/data-explorer/kusto/query/best-practices
-
https://github.com/Azure/Azure-Security-Center/tree/master/Kusto/Azure%20Resource%20Graph
-
On OReilly.com:
https://github.com/oreillymedia/Hands-On-Kusto-Query-Language
https://github.com/razi-rais/Microsoft-Security-Operations-Analyst-Bootcamp/tree/main/resources
YouTube videos:
CxE KQL hands-on lab exercises videos:
-
part 1 of 3 by Ofer Shezaf [Deck]
On Pluralsight.com:
-
4 hr VIDEO COURSE: “Kusto Query Language (KQL) from scratch” by Robert Cain, who also has an Advanced course.
-
2.45 hr VIDEO COURSE: Exploring Data in Microsoft Azure Using Kusto Query Language and Azure Data Explorer by Neeraj Kumar (@mstechtrainings) makes use of NOAA’s Storm Events Database.
-
4h VIDEO COURSE: How to Start with Microsoft Azure Data Explorer (ADX) 29 Jun 2020 by Xavier Morera
- https://www.pluralsight.com/partners/microsoft/azure-data-explorer
- https://docs.microsoft.com/en-us/azure/data-explorer/security-baseline
GenAI chat
The Microsoft Security Copilot service (https://securitycopilot.microsoft.com/) offers a chat interface to interact with the Security Copilot service.
Hands-on a sample database
-
Open demo data from Microsoft:
https://aka.ms/LADemo which resolves to:
https://portal.loganalytics.io/demo -
Click this to open the Log Analytics demo environment:
https://portal.azure.com/#blade/Microsoft_Azure_Monitoring_Logs/DemoLogsBlade
Learn more about Log Analytics: Quickly retrieve, consolidate, and analyze all data collected into Azure Monitoring Logs. Save your queries for future use, pin query results to Azure Dashboards, and create log alerts.
Query Language: Log Analytics uses a version of the Kusto Query language (KQL) that is suitable for both simple and advanced log queries using functionality such as aggregations, joins, and smart analytics.
-
Click the X at the upper-right to close the introduction modal page, for the “Logs Demo” page on the Portal, with “New Query 1” tab.
-
Click “Not now” to pop-up “Select a table or choose one of the categories on the left to see tables, queries, functions, and query history. Click Run to get query results.”
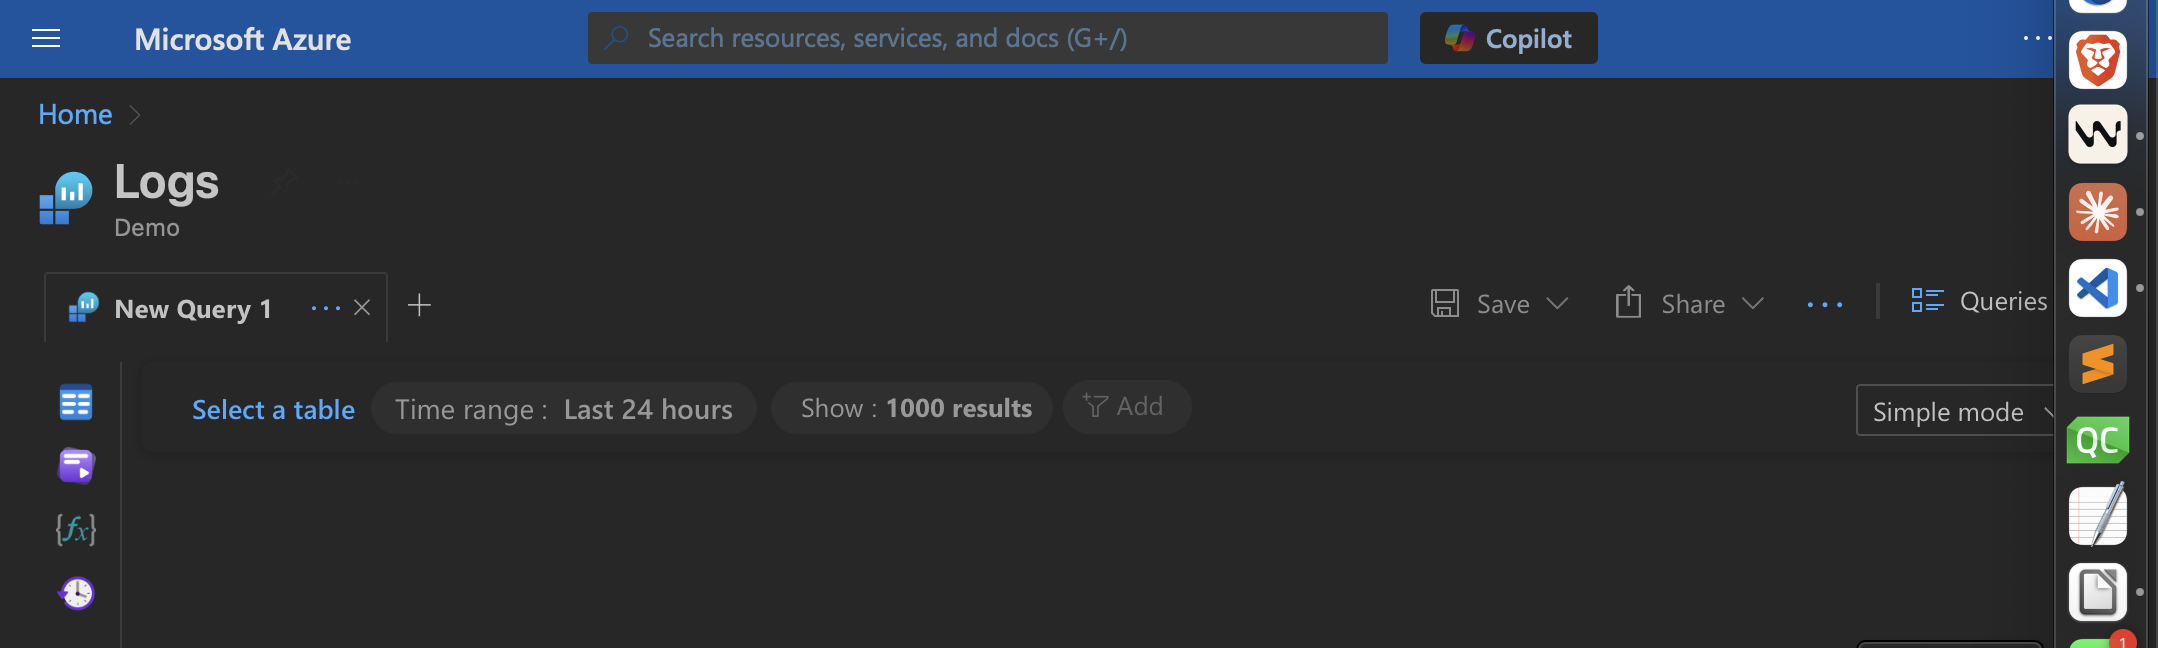
Icons on the left:
- Tables
- Queries
- Functions
- Query history
-
Click “Simple mode” (for clicking GUI) at the right to switch to “KQL mode” (for typing commands). For repeatability, make it your default.
Sample KQL Queries
- Click “Queries hub” to see all saved queries.
-
Click “Community Git repo” at the top to see the “open repo for Azure Monitor queries, workbooks, alerts and more”:
https://github.com/microsoft/AzureMonitorCommunity
-
Click through its folders to see:
- Azure Services
- Scenarios
- Solutions
There is also:
https://github.com/Azure/Azure-Sentinel/blob/master/Hunting - Click “Query explorer” tab at the right.
- Expand “Saved Queries”
- Double-click on “Pluralsight” to expand the category.
-
Click to open “m2-table-80-percent”.
OBSERVE: Clicking completely replaces the existing KQL entry, without needing to clear it first.
// precede all comments in code.
-
Highlight a query, click blue “Run” or hold down Shift and press Enter.
CAUTION: “No result” will be returned if there is no data.
“Perf” is the table name to search in. This table has these fields visible:
TenantId Computer ObjectName ObjectName CounterName InstanceName -
To see more columns, drag the horizonal bar or on the Touchpad move two fingers to the left:
CounterValue CounterPath StandardDeviation Type _ResourceID TenantID SourceSystem MG -
PROTIP: The full list of columns for this and all other tables is:
https://docs.microsoft.com/en-us/azure/azure-monitor/reference/tables/perf
-
Set the Time Frame or set in the script text:
| where TimeGenerated >= ago(1h)
PROTIP: Several where statements can be stacked.
Operators
-
For operators, click on the KQL query text area and press command+Enter:
- where - filter
- count
- extend - creates a calculated column in the result set (before project)
- join
- limit
- lookup
- order
- project - select a subset of columns (instead of all columns from table)
- project-away - remove column
-
To scroll for more, mouse over the list and slide two-fingers on the Mac Touchpad:
- sort
- summarize
-
search
- distinct - to not repeat values shown
- make-series
- mv-apply
- mv-expand
- take 5 // return 5 records
- top 20 // rows
- top-nested
…
The Pluralsight video covers search, where, take, count, summarize, extend, project, distinct.
Examples to limit too much being returned (and wasting time):
| search kind=case_sensitive "memory"
| search in (Perf, Event, Alert) "Contoso"
-
Use colon to search text wildcard:
| search CounterName:"MBytes"
-
Limit column:
| search * starswith "Bytes"
| search * endswith "Bytes"
| search "Free*Bytes" // Any that Begins with free or ends with bytes
| search InstanceName matches regex "[A-Z]:*"
-
Click “m3-demo-scalar” explained by this VIDEO covering Scalar Operators:
print, now() UTC, ago(-7d), sort by asc, extract, parse, datetime, Timespan Artithmetic, startof…, endof…, between, todynamic, format_datetime, format_timespan, datetime_aart, case, iif, isempty/isnull, split, String Operators, strcat
-
Click “m4-demo-advanced-aggregations” explained by this VIDEO
- summarize arg_max/arg_min( column ),
- makelist - flaten a hierarchy to a JSON array, allowing dup. values
- makeset - flaten a hierarchy to a JSON array, removing dup. values
For a list of PCs with low disk space:
Perf
| where CounterName == "% Free Space"
|   and CounterValue <= 30
| summarize Computers = makeset(Computer)
- mvexpand, percentiles, dcount (distinct count, accuracy), dcountif, countif, pivot, top-nested, max/min, sum/sumif, any
Datasets
-
Click “m5-demo-working-with-datasets” explained by this VIDEO
- let, join (tables), union (combine) with source, kind=outer
- datatable, prev/next, toscalar, row_cumsum, materialize
Time Series
- Click “m6-demo-time-series” explained by this VIDEO
Machine Learning
-
Click “m7-data-machine-learning” explained by this VIDEO Machine Learning
- evaulate basket(threshold) - for the most frequently appearing combination of attributes, given the threshold for minimum frequency (default 0.05 or 5%)
- autocluster
- evaulate diffpatterns(EventLevelName, ‘Error’, ‘Warning’) // splits dataset to identify differences as “Error” or “Warning”. Use iif to flag metrics before and after the incident.
- reduce by Computer with threshold = 0.6 // to determine pattern, with default threshold of 0.1.
Exporting data to CSV
-
Click “m8-exporting-data” explained by this VIDEO
- To export to CSV file, run query and click the export icon.
- Select Export to CSV - all columns or display columns.
- In the pop-up at the bottom, click Save As.
- Specify the folder and file name.
Run KSL in PowerBI Desktop
- Copy the Query to your Clipboard.
- Download and install PowerBI Desktop from https://powerbi.microsoft.com/desktop
- Open PowerBI
- In Home group, Get Data - Blank Query
- Advanced Editor
- Paste the query (command+V). Done runs the query.
- Close and apply changes.
- Create visualizations, etc.
More examples
Events
| where StartTime >= datetime(2018-11-01) and StartTime < datetime(2018-12-01)
| where State == "FLORIDA"
| count
KQL in Data Explorer
-
Pluralsight VIDEO course Microsoft Azure Data Explorer - Advanced KQL by Robert Cain.
-
Download and expand microsoft-azure-data-explorer-advanced-query-capabilities.zip to view folder module-05-performing-diagnostic-and-root-cause-analysis.
-
??? Load into Azure
covers functions,
inline Python & R code (converted to KQL string by highlighting then Ctrl+K & Ctrl+S).
Analyze data using geospatial analysis,
Root Cause Analysis Diagnostics
clustering algorithms, time series analysis.
Exploring data using Kusto
-
Exploring Data in Microsoft Azure Using Kusto Query Language and Azure Data Explorer, download exercise file microsoft-azure-data-exploring.zip (to your Downloads folder) and unzip. In folder coursfiles, ??
JMESPath
The https://github.com/jmespath/jmespath.terminal Python package offers an interactive environment to work with queries. Data is piped as input, and then queries are written and run in the editor:
pip install jmespath-terminal
az vm list --output json | jpterm
From: https://docs.microsoft.com/en-us/cli/azure/query-azure-cli
More on Azure
This is one of a series on Azure:
- DevOps_2.0
- ci-cd (Continuous Integration and Continuous Delivery)
- User Stories for DevOps
- Git and GitHub vs File Archival
- Git Commands and Statuses
- Git Commit, Tag, Push
- Git Utilities
- Data Security GitHub
- GitHub API
- Choices for DevOps Technologies
- Pulumi Infrastructure as Code (IaC)
- Java DevOps Workflow
- AWS DevOps (CodeCommit, CodePipeline, CodeDeploy)
- AWS server deployment options
- Cloud services comparisons (across vendors)
- Cloud regions (across vendors)
- Azure Cloud Onramp (Subscriptions, Portal GUI, CLI)
- Azure Certifications
- Azure Cloud Powershell
- Bash Windows using Microsoft’s WSL (Windows Subsystem for Linux)
- Azure Networking
- Azure Storage
- Azure Compute
- Digital Ocean
- Packer automation to build Vagrant images
- Terraform multi-cloud provisioning automation
-
Hashicorp Vault and Consul to generate and hold secrets
- Powershell Ecosystem
- Powershell on MacOS
- Jenkins Server Setup
- Jenkins Plug-ins
- Jenkins Freestyle jobs
- Docker (Glossary, Ecosystem, Certification)
- Make Makefile for Docker
- Docker Setup and run Bash shell script
- Bash coding
- Docker Setup
- Dockerize apps
- Ansible
- Kubernetes Operators
- Threat Modeling
- API Management Microsoft
- Scenarios for load
- Chaos Engineering