
Open-source server to display metrics for DevSecOps and others
![]()
![]()
![]()
![]()
![]()
![]()
![]()
![]()
![]()
![]()
![]()
![]()
![]()
Overview
- Origins
- Competitors
- Grafana Products
- Install Grafana Agent on macOS for Cloud
- Install Grafana Server on macOS
- Releases
- Data sources
- Filters
- Panels within Dashboard
- Share (archive) dashboard
- Metrics
- Snapshots
- Alerts
- NASA OpenMCT Dashboard
- Videos from Grafana.com
- Templates
- SQL
- Plug-ins
- Videos
- Social Media
- More on DevOps
This article are my notes about Grafana, marketed at Grafana.com, with documentation at https://grafana.com/docs/grafana/latest
NOTE: Content here are my personal opinions, and not intended to represent any employer (past or present). “PROTIP:” here highlight information I haven’t seen elsewhere on the internet because it is hard-won, little-know but significant facts based on my personal research and experience.
My contribution here is logical sequencing for a deep yet concise hands-on tutorial.
Origins
Grafana began in 2014 at https://github.com/Grafana/Grafana. It quickly became one of the most popular open source projects on GitHub.
The original developer, Torkel Ödegaard (@Grafana@torkelo), formerly at eBay Stockholm, Sweden, spoke Dec. 19, 2014 in San Francisco six months after release.
- Grafana is written in Golang.
- [21:53] “I work on this full time, mostly paid by my own savings. But I have sponsors in Squarespace and Dreamhost”.
Grafana is a visualization tool for metrics, such as time series data for DevOps and other purposes.
Competitors
- Kibana from Elastic
-
Tableau from Salesforce
- NetData
- Datadog
- Sumo Logic
- Splunk
- Honeycomb
- Dynatrace
- New Relic
- AppDynamics
- SignalFX
- InfluxDB
Grafana Products
Grafana runs in several modes:
- Grafana (local) server
- Grafana Cloud operated by Grafana, Inc., with a free tier and paid enterprise tier.
Here’s an alphabetical list of Grafana products:
-
Grafana Tempo has a TraceQL (Query Language) to query traces and logs in Parquet format databases such as S3, GCS, and Azure Blob Storage. It’s based on PromQL and LogQL. Works on Grafana 9.4+. Tempo is a OpenTelemetry-compatible endpoint.
-
Grafana Agent - Prometheus-compatible metrics collection agent based on the OpenTelemetry specification, designed to be highly available, horizontally scalable, and fault tolerant.
-
Grafana Beyla - eBPF auto-instrumentation for Linux. It’s a tool that automatically instruments Linux applications with eBPF to collect metrics and traces.
- Grafana Cloud - a hosted version of Grafana, Prometheus, Loki, and Tempo. It’s designed to be highly available, horizontally scalable, and fault tolerant.
- https://grafana.com/products/cloud/
- https://grafana.com/docs/grafana-cloud/quickstart/
-
Grafana Cortex - Multi-tenant, horizontally scalable Prometheus-as-a-Service. It’s a multi-tenant, horizontally scalable Prometheus-as-a-Service. It’s designed to be highly available, horizontally scalable, and fault tolerant.
-
Grafana Enterprise - Enterprise version of Grafana. It’s an enterprise version of Grafana that adds enterprise data sources, advanced authentication options (LDAP, SAML), more permission controls, 24x7x365 support, and training from the core Grafana team.
-
Grafana Foro - front-end application observability web SDK to instrument web applications. It’s designed to be highly available, horizontally scalable, and fault tolerant.
-
Grafana Graphite - Graphite data source for Grafana. It’s a data source for Grafana that allows you to query and visualize data from Graphite.
-
Grafana Graphite-Consul - Graphite data source for Grafana. It’s a data source for Grafana that allows you to query and visualize data from Graphite.
-
Grafana K6 - an open-source load testing tool for Load testing tool for developers and DevOps teams to run performance tests against APIs, microservices, and web sites. spike, stress, and soak tests.
-
Grafana Loki - Log aggregation system inspired by Prometheus. It’s a horizontally-scalable, highly-available, multi-tenant log aggregation system inspired by Prometheus. It’s designed to be cost-effective and easy to operate, as it does not index the contents of the logs, but rather a set of labels for each log stream.
-
Grafana Mimir - A multi-tenant distributed time series database backend built on top of Apache Cassandra and Apache Kafka. It’s designed to be highly available, horizontally scalable, and fault tolerant.
-
Grafana Metrictank - Multi-tenant timeseries platform for Graphite. It’s a multi-tenant time-series platform for Graphite that is designed to be highly available, horizontally scalable, and fault tolerant.
-
Grafana OnCall - Incident management system for DevOps teams. It’s an incident management system that helps DevOps teams manage on-call schedules and escalations, and provides a platform for incident response.
-
Grafana Promtail - Log agent for Loki. It’s a log agent for Loki that runs on every machine and tails log files, aggregates log data, and forwards it to Loki.
-
Grafana Tempo - Distributed tracing backend. It’s a distributed tracing backend that is designed to be highly available, horizontally scalable, and fault tolerant. It’s based on the OpenTelemetry specification.
- Grafana Tanka - A flexible tool for managing Kubernetes configuration using Jsonnet. It’s a flexible tool for managing Kubernetes configuration using Jsonnet.
Install Grafana Agent on macOS for Cloud
- https://grafana.com/blog/2022/05/20/introducing-the-macos-integration-for-grafana-cloud/
- https://www.linkedin.com/pulse/monitoring-your-mac-prometheus-stephen-townshend/
-
Using Homebrew, install the Grafana Agent universal collector to collect metrics, including Mac-specific memory metrics, and logs from macOS for use in the Grafana Cloud:
brew tap grafana/grafana
brew install grafana-agent
QUESTION: Difference vs Prometheus Node Exporter?
Notice the response (at time of writing) installs a specific edition for a specific version of macOS (such as Ventura):
grafana-agent 0.39.1 is already installed but outdated (so it will be upgraded).
==> Downloading https://ghcr.io/v2/homebrew/core/grafana-agent/manifests/0.39.2
######################################################################################################################################### 100.0%
==> Fetching grafana-agent
==> Downloading https://ghcr.io/v2/homebrew/core/grafana-agent/blobs/sha256:569e8abf8904d7292fcd413253ca9bb06bc38c7807108079f25f4dcc70bb9e22
######################################################################################################################################### 100.0%
==> Upgrading grafana-agent
  0.39.1 -> 0.39.2

==> Pouring grafana-agent--0.39.2.ventura.bottle.tar.gz
==> Caveats
The agent uses a configuration file that you must customize before running:
  /usr/local/etc/grafana-agent/config.yml

To start grafana-agent now and restart at login:
  brew services start grafana-agent
Or, if you don't want/need a background service you can just run:
  /usr/local/opt/grafana-agent/bin/grafana-agent -config.file /usr/local/etc/grafana-agent/config.yml
==> Summary
🍺  /usr/local/Cellar/grafana-agent/0.39.2: 9 files, 422.7MB
==> Running `brew cleanup grafana-agent`...
Disable this behaviour by setting HOMEBREW_NO_INSTALL_CLEANUP.
Hide these hints with HOMEBREW_NO_ENV_HINTS (see `man brew`).
Removing: /usr/local/Cellar/grafana-agent/0.39.1... (9 files, 422.7MB)
Removing: /Users/wilsonmar/Library/Caches/Homebrew/grafana-agent--0.39.1... (108.6MB)
-
If you don’t have a Grafana Cloud account, make one here, otherwise, Log in by providing the email your registered for, then click “Sign in”.
-
Find “macOS integration” at https://grafana.com/docs/grafana-cloud/monitor-infrastructure/integrations/integration-reference/integration-macos-node/
-
The pre-built dashboard includes the most important macOS metrics such as CPU, memory, network, and disk usage.
As with other Grafana Cloud integrations, macOS logs panels are bundled so that they can be quickly accessed when you need more information about what’s going on with your Mac.
- In your Grafana Cloud stack, click Connections in the left-hand menu.
- Find macOS and click its tile to open the integration.
- Review the prerequisites in the Configuration Details tab and set up Grafana Agent to send macOS metrics and logs to your Grafana Cloud instance.
-
Click Install to add this integration’s pre-built dashboards and alerts to your Grafana Cloud instance, and you can start monitoring your macOS setup.
-
https://www.grafana.com/download
Promtail pipelines parse logs to extract additional fields including logs source (sender). Thanks to this, logs can be filtered by sender to narrow down the results.
Install Grafana Server on macOS
- https://logz.io/blog/grafana-tutorial/
-
https://www.grafana.com/download
Grafana’s releases are sematically tagged.
There is an Enterprise Edition because the organization makes money by selling its Enterprise edition and cloud services. See https://grafana.com/docs/grafana-cloud/quickstart/logs_agent_linuxnode/
Enterprise edition
https://grafana.com/docs/grafana/latest/setup-grafana/configure-grafana/
Their Install Guide says “Open Source - Functionally identical to the enterprise version, but you will need to download the enterprise version if you want enterprise features”
Grafana Enterprise adds enterprise data sources, advanced authentication options (LDAP, SAML), more permission controls, 24x7x365 support, and training from the core Grafana team.
There is no installer for MacOS Enterprise, so run the Docker image on your Mac.
Raspberry Pi
There is an installer for ARM chips (Raspberry Pi). See https://www.hackster.io/search?i=projects&q=grafana
Releases
-
Details about each release are at:
https://github.com/grafana/grafana/releases
- Grafana v10
- The Launch of Grafana v5
- Grafana v5.0 Alpha Preview 2:32
- What’s New In Grafana v5.0 1:32
-
Install using Homebrew:
brew install grafana
The response at time of writing:
🍺 /usr/local/Cellar/grafana/10.2.3: 7,714 files, 349.5MB
History:
- grafana/6.6.1: 4,417 files, 189.6MB
- grafana/6.6.1: 4,417 files, 189.6MB
-
Set the version number for commands to follow:
GRAFANA_VER=$( grafana version 10.2.3 )
echo "GRAFANA_VER=$GRAFANA_VER"  # GRAFANA_VER=10.2.3
-
For a list of commands:
grafana-cli
Server
-
Confirm server version installed:
grafana-server -v
The response at time of writing:
Version 9.1.6 (commit: unknown-dev, branch: main)
Configure Server
PROTIP: Avoid altering the defaults.ini file at: /opt/homebrew/Cellar/grafana/9.1.6/share/grafana/conf/defaults.ini
-
Copy file grafana.ini to make a custom.ini file in folder conf:
- /opt/homebrew/Cellar/grafana/9.1.6/.bottle/etc/grafana/grafana.ini
- /usr/local/etc/grafana/grafana.ini
Change only what needs customization by uncommentine lines, removing the semicolon from the beginning of each line.
Starting Server
-
To have launchd start grafana now and restart automatically at login:
sudo brew services start grafana
To stop:
sudo brew services stop grafana
-
Load the server:
brew tap homebrew/services
-
If you don’t want/need a background service, On an ARM M1 Mac, build the execution command with the version number at:
/opt/homebrew/Cellar/grafana/$GRAFANA_VER/bin/grafana-server
Alternately, on a x86 Intel mac:
/usr/local/Cellar/grafana/$GRAFANA_VER/bin/grafana-server
-
Define configuration files Alternately, you can just run on Linux:
sudo grafana-server --config=/usr/local/etc/grafana/grafana.ini \
--homepath /usr/local/share/grafana \
--packaging=brew cfg:default.paths.logs=/usr/local/var/log/grafana \
cfg:default.paths.data=/usr/local/var/lib/grafana \
cfg:default.paths.plugins=/usr/local/var/lib/grafana/plugins
UI
http://localhost:3000/login
-
Type in your password and click Allow.

The response, for example:
INFO[03-11|17:19:43] Starting Grafana                         logger=server version=6.6.1 commit=unknown-dev branch=master compiled=2020-02-06T10:22:13-0700
INFO[03-11|17:19:43] Config loaded from                       logger=settings file=/usr/local/share/grafana/conf/defaults.ini
INFO[03-11|17:19:43] Config loaded from                       logger=settings file=/usr/local/etc/grafana/grafana.ini
INFO[03-11|17:19:43] Config overridden from command line      logger=settings arg="default.paths.data=/usr/local/var/lib/grafana"
INFO[03-11|17:19:43] Config overridden from command line      logger=settings arg="default.paths.logs=/usr/local/var/log/grafana"
INFO[03-11|17:19:43] Config overridden from command line      logger=settings arg="default.paths.plugins=/usr/local/var/lib/grafana/plugins"
INFO[03-11|17:19:43] Path Home                                logger=settings path=/usr/local/share/grafana
INFO[03-11|17:19:43] Path Data                                logger=settings path=/usr/local/var/lib/grafana
INFO[03-11|17:19:43] Path Logs                                logger=settings path=/usr/local/var/log/grafana
INFO[03-11|17:19:43] Path Plugins                             logger=settings path=/usr/local/var/lib/grafana/plugins
INFO[03-11|17:19:43] Path Provisioning                        logger=settings path=/usr/local/share/grafana/conf/provisioning
INFO[03-11|17:19:43] App mode production                      logger=settings
INFO[03-11|17:19:43] Initializing SqlStore                    logger=server
INFO[03-11|17:19:43] Connecting to DB                         logger=sqlstore dbtype=sqlite3
INFO[03-11|17:19:43] Starting DB migration                    logger=migrator
INFO[03-11|17:19:43] Initializing HTTPServer                  logger=server
INFO[03-11|17:19:43] Initializing BackendPluginManager        logger=server
INFO[03-11|17:19:43] Initializing PluginManager               logger=server
INFO[03-11|17:19:43] Starting plugin search                   logger=plugins
INFO[03-11|17:19:43] Initializing HooksService                logger=server
INFO[03-11|17:19:43] Initializing OSSLicensingService         logger=server
INFO[03-11|17:19:43] Initializing InternalMetricsService      logger=server
INFO[03-11|17:19:43] Initializing RemoteCache                 logger=server
INFO[03-11|17:19:43] Initializing QuotaService                logger=server
INFO[03-11|17:19:43] Initializing ServerLockService           logger=server
INFO[03-11|17:19:43] Initializing UserAuthTokenService        logger=server
INFO[03-11|17:19:43] Initializing RenderingService            logger=server
INFO[03-11|17:19:43] Initializing AlertEngine                 logger=server
INFO[03-11|17:19:43] Initializing DatasourceCacheService      logger=server
INFO[03-11|17:19:43] Initializing LoginService                logger=server
INFO[03-11|17:19:43] Initializing SearchService               logger=server
INFO[03-11|17:19:43] Initializing TracingService              logger=server
INFO[03-11|17:19:43] Initializing UsageStatsService           logger=server
INFO[03-11|17:19:43] Initializing CleanUpService              logger=server
INFO[03-11|17:19:43] Initializing NotificationService         logger=server
INFO[03-11|17:19:43] Initializing provisioningServiceImpl     logger=server
INFO[03-11|17:19:43] Backend rendering via phantomJS          logger=rendering renderer=phantomJS
WARN[03-11|17:19:43] phantomJS is deprecated and will be removed in a future release. You should consider migrating from phantomJS to grafana-image-renderer plugin. logger=rendering renderer=phantomJS
INFO[03-11|17:19:43] Initializing Stream Manager
INFO[03-11|17:19:43] HTTP Server Listen                       logger=http.server address=[::]:3000 protocol=http subUrl= socket=
-
List the process
Upgrade Grafana version
-
To upgrade Grafana:
brew reinstall grafana
Data sources
Grafana has a growing list of data sources it can read from, via plug-ins:
- CloudWatch
-
Elasticsearch (document database)
- Graphite
- Microsoft SQL Server
- MySQL
-
ProtgreSQL
- OpenTSDB (time series database)
- InfluxDB
- Prometheus
2h 43m PromQL for Prometheus 2.3.1 within a Docker image. He recommends having each project deploy its own Prometheus and Grafana instance rather than a central monitoring stack, sharing the admin burden. need to be highly available.
Datasource Plugin Thrunk (by Sven Nierlein)?
Filters
PROTIP: Define filter statements before jumping into the Grafana UI.
Panels within Dashboard
Within each dashboard are panels with rows.
To add an additional panel within an established dashboard:
- In your profile, get Editor Role.
- No need to designate a data source.
- Star the dashboard (Mark as favorite) on the top menu.
-
Set Home Dashboard in Preferences.
- Add panel.
- Choose visualization.
- Graph.
Share (archive) dashboard
- Click on the share icon at the top menu.
- Click Export tab.
- Consider “Export for sharing externally”.
-
Click “Save to file”. Adjust folder and file name.
PROTIP: Save the file in GitHub for Infrastructure as Code. Then you won’t need to add a date/time stamp to the file.
- Add tab, Add Row
- Click on Row gear icon for options.
- Update.
- Click icon at top. Dummy graph appears.
- Change Panel Title.
- Select Data Source: “prometheus”.
- Add query string
- Set Panel Title.
Metrics
The Grafana Cloud forever-free tier includes 3 users and up to 10,000 metrics series with 50 GB of logs, traces, profiles, with 14 days of retention.
The health of Hardware resources is evaluated using the USE metrics:
Utilization, Saturation, Errors. Each indicates a symptom of problems. The relationship of levels among them provides additional clues about the problem.
The health of service-oriented resources is evaluated using the REDS metrics:
Requests, Errors, Duration, Saturation, what Google calls the “Four Golden Signals”.
They are a good proxy for users’ actual experience.
PROTIP: Standardizing the layout of dashboards across an organization enables various operators across different teams to more quickly collaborate on the interpretation of dashboards.
An example dashboard for macOS:

- Grafana’s Big Tent podcast about olly
Snapshots
PROTIP: Set an expiration on snapshots to avoid clutter.
Publish snapshots to snapshot.raintank.io
Alerts
Key alerting rules included:
- NodeFilesystemAlmostOutOfSpace (Warning)
-
NodeFilesystemAlmostOutOfSpace (Critical)
- NodeFilesystemFilesFillingUp (Warning)
-
NodeFilesystemFilesFillingUp (Critical)
- NodeFilesystemAlmostOutOfFiles (Warning)
-
NodeFilesystemAlmostOutOfFiles (Critical)
- NodeNetworkReceiveErrs (Warning)
- NodeNetworkTransmitErrs (Warning)
- NodeTextFileCollectorScrapeError (Warning)
NASA OpenMCT Dashboard
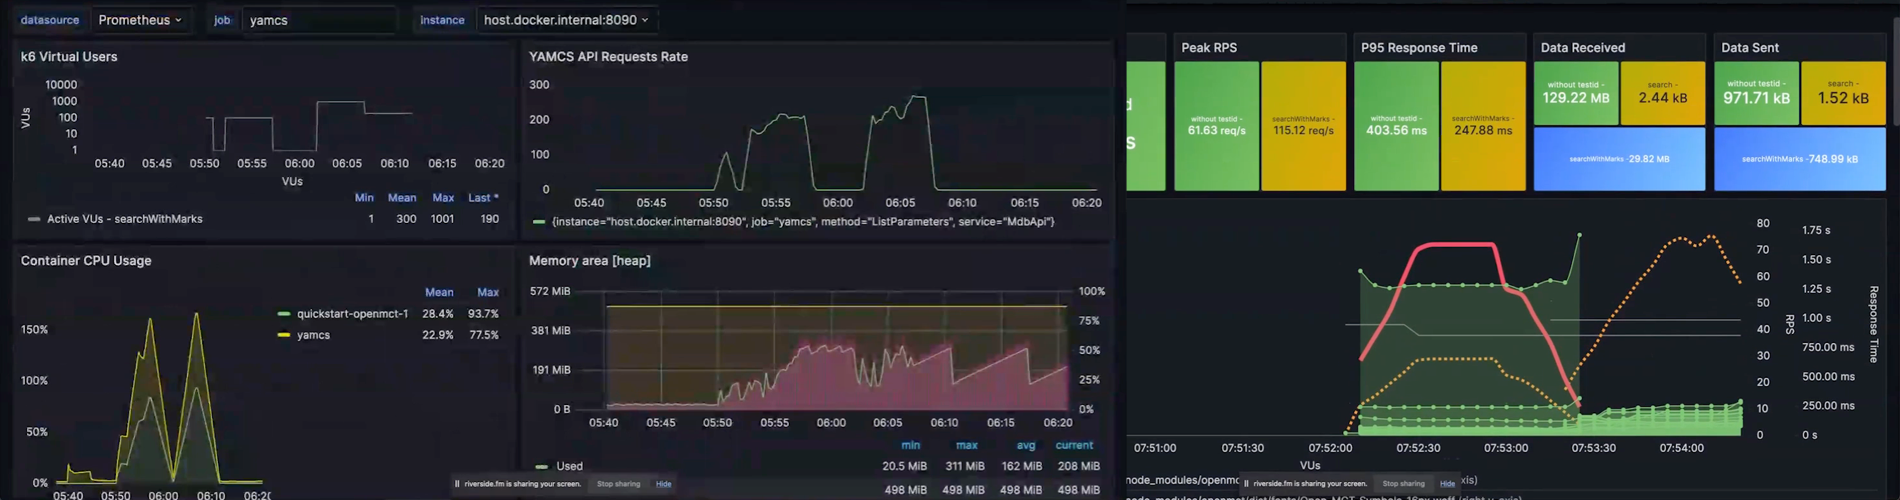
VIDEO by John Hill: “Automated performance modeling with NASA Open MCT, Grafana Cloud, and k6” https://nasa.github.io/openmct/ = Open MCT is a next-generation mission operations data visualization framework. Web-based, for desktop and mobile.

OpenMCT had the most public engagement among all NASA open source projects
https://devpost.com/software/openmct
https://github.com/nasa/openmct-demo
-
After reading my Node Install
-
Navigate to a folder where your project will be created.
cd ~/gh
-
Clone the most starred NASA project on Github:
git clone https://github.com/nasa/openmct --depth 1
cd openmct
-
Install dev dependencies:
npm install
Packages installed include: autoconf, awscli, c-ares, curl, openssl@3, lightg, gettext, numpy, openblas, python@3.12, localstack, pipenv, python-argcomplete, python-jinga, python-markdown, python-requests, python-sphinx, python-yaml, sphinx-rtd-theme, and tox.
Results:
Could not symlink bin/activate-global-python-argcomplete
Target /usr/local/bin/activate-global-python-argcomplete
already exists. You may want to remove it:
  rm '/usr/local/bin/activate-global-python-argcomplete'

To force the link and overwrite all conflicting files:
  brew link --overwrite python-argcomplete

To list all files that would be deleted:
  brew link --overwrite --dry-run python-argcomplete

Possible conflicting files are:
/usr/local/bin/activate-global-python-argcomplete
/usr/local/bin/python-argcomplete-check-easy-install-script
/usr/local/bin/register-python-argcomplete
Error: Could not symlink share/bash-completion/completions/gapplication
Target /usr/local/share/bash-completion/completions/gapplication
is a symlink belonging to glib. You can unlink it:
  brew unlink glib

To force the link and overwrite all conflicting files:
  brew link --overwrite glib
-
Run local dev server:
npm start
Response:
> openmct@3.3.0-next start > npx webpack serve --config ./.webpack/webpack.dev.js Need to install the following packages: webpack@5.90.0 Ok to proceed? (y) y CLI for webpack must be installed. webpack-cli (https://github.com/webpack/webpack-cli) We will use "npm" to install the CLI via "npm install -D webpack-cli". Do you want to install 'webpack-cli' (yes/no): yes Installing 'webpack-cli' (running 'npm install -D webpack-cli')... npm WARN deprecated argv@0.0.2: Package no longer supported. Contact Support at https://www.npmjs.com/support for more info. npm WARN deprecated codecov@3.8.3: https://about.codecov.io/blog/codecov-uploader-deprecation-plan/ added 994 packages, and audited 995 packages in 49s 131 packages are looking for funding run `npm fund` for details found 0 vulnerabilities Error: Cannot find module 'webpack-cli/package.json' Require stack: - /Users/wilsonmar/.npm/_npx/89d6e678e21f2dae/node_modules/webpack/bin/webpack.js at Module._resolveFilename (node:internal/modules/cjs/loader:1149:15) at Function.resolve (node:internal/modules/helpers:187:19) at runCli (/Users/wilsonmar/.npm/_npx/89d6e678e21f2dae/node_modules/webpack/bin/webpack.js:78:26) at /Users/wilsonmar/.npm/_npx/89d6e678e21f2dae/node_modules/webpack/bin/webpack.js:176:5 at process.processTicksAndRejections (node:internal/process/task_queues:95:5) { code: 'MODULE_NOT_FOUND', requireStack: [ '/Users/wilsonmar/.npm/_npx/89d6e678e21f2dae/node_modules/webpack/bin/webpack.js' ] } -
Install again:
npm install
This time:
> openmct@3.3.0-next prepare
> npm run build:prod && npx tsc

> openmct@3.3.0-next build:prod
> webpack --config ./.webpack/webpack.prod.js

webpack compiled successfully

up to date, audited 995 packages in 1m

131 packages are looking for funding
  run `npm fund` for details

found 0 vulnerabilities
-
Try again:
cd
cd gh
git clone git@github.com:nasa/openmct-tutorial.git --depth 1
cd openmct-tutorial
npm install
npm start
Response:
> openmct@3.3.0-next start
> npx webpack serve --config ./.webpack/webpack.dev.js

 [webpack-dev-server] Project is running at:
 [webpack-dev-server] Loopback: http://localhost:8080/
 [webpack-dev-server] On Your Network (IPv4): http://192.168.1.17:8080/
 [webpack-dev-server] On Your Network (IPv6): http://[fe80::1]:8080/
 [webpack-dev-server] Content not from webpack is served from '/Users/wilsonmar/github-wilsonmar/openmct/dist' directory
webpack compiled successfully
</pre>
-
Open a browser to http://192.168.1.17:8080/
You should see “My Items”.
-
Open another Terminal:
cd
cd gh
git clone git@github.com:nasa/openmct-tutorial.git --depth 1
cd openmct-tutorial
npm install
npm start
Response:
npm WARN EBADENGINE Unsupported engine { npm WARN EBADENGINE package: 'openmct@3.0.2', npm WARN EBADENGINE required: { node: '>=16.19.1 <20' }, npm WARN EBADENGINE current: { node: 'v21.6.1', npm: '10.2.4' } npm WARN EBADENGINE } added 63 packages, and audited 64 packages in 2s 8 packages are looking for funding run `npm fund` for details 1 high severity vulnerability To address all issues, run: npm audit fix --force Run `npm audit` for details. -
Try to fix the vulnerability:
npm audit fix --force
Response:
npm WARN using --force Recommended protections disabled.
npm WARN audit Updating openmct to 3.2.0, which is outside your stated dependency range.

changed 1 package, and audited 64 packages in 3s

8 packages are looking for funding
  run `npm fund` for details

found 0 vulnerabilities
</pre>
-
Open a browser to https://github.com/nasa/openmct-tutorial/tags and notice the commit tags holding files:
- part-a
- part-b-step-1
- part-b-step-2
- part-b-step-3
- part-b-step-4
- part-c
- part-d
NOTE: Git tags are mark specific points in your project’s history as significant, typically to denote project releases.
-
Press command+shift+ \ to open another Terminal:
cd ~/github-wilsonmar/openmct-tutorial
git tag
Result:
error: pathspec 'part-X-step-N' did not match any file(s) known to git
-
Select the branch to work on:
git checkout -f part-b-step-1
-
Start:
npm start
Response:
> openmct-tutorials@0.0.1 start
> node example-server/server.js

Example spacecraft launched!
Press Enter to toggle thruster state.
Open MCT hosted at http://localhost:8080
History hosted at http://localhost:8080/history
Realtime hosted at ws://localhost:8080/realtime
-
Press Enter on keyboard for:
Thrusters ON
-
Press Enter on keyboard for:
Thrusters OFF
-
Stop the server by pressing control-C.
-
View the index.html file associated with each branch, such as:
https://github.com/nasa/openmct-tutorial/blob/part-a/index.html
-
Point Git to the tag:
git checkout -f part-a
FIXME: Response:
error: pathspec 'part-b-step-2' did not match any file(s) known to git
-
Open a browser to http://localhost:8080/
Response:
Cannot GET /history
Videos from Grafana.com
VIDEO: Grafana’s schema-driven data language: Cuetsy and Thema
Torkel himself presents 12 videos in this YouTube Playlist also listed in the Grafana website:
openmct@3.3.0-next start npx webpack serve –config ./.webpack/webpack.dev.js
[webpack-dev-server] Project is running at: [webpack-dev-server] Loopback: http://localhost:8080/ [webpack-dev-server] On Your Network (IPv4): http://192.168.1.17:8080/ [webpack-dev-server] On Your Network (IPv6): http://[fe80::1]:8080/ [webpack-dev-server] Content not from webpack is served from ‘/Users/wilsonmar/github-wilsonmar/openmct/dist’ directory webpack compiled successfully 1/. Building Graphite Queries Sep 15, 2014 [14:02]
A leaf note is a variable that contains data (such as count, dollars, etc.).
{} braces glob individual metrics together.
-
Templated Graphite Queries Sep 16, 2014 12:55
-
What’s New in Grafana 2.0 Apr 19, 2015 [13:48]
-
Elasticsearch 24:42
Templates
Templates enable you to add variables
- In Dashboard settings, Features tab, enable Templating checkbox. Close.
- Click the gear next to VARIABLES.
- Add a variable with a query type.
- All option to use a * wildcard in the query.
-
Click the green > arrow to see values returned.
- Also, add an interval type of variable.
- Edit the time periods suggested in the Value field.
- In the Graph, change the summarize to specify the variable.
-
VARIABLES: $internval auto [11:10]
- Variable “smoothing” with Type custom [11:24]
- Change the movingAverage value to $smoothing
- Templating & Annotations GrafanaCon Mar 12, 2019 [24:47] by Daniel Lee
SQL
Grafana adds WHERE clause for time, such as $__timeFilter(time).
Plug-ins
https://grafana.com/grafana/plugins
grafana-cli plugins install sni-thruk-datasource
Videos
Monitoring Containerized Application Health with Docker
by Elton Stoneman 8 Aug 2018
How To Setup A Grafana Dashboard Step By Step - SQL4automation 21:00
Grafana Project Update & What’s New in v6.0 Mar 11, 2019 [40:31] Grafana Loki for Logs [11:40] In 2013 Grafana was re-written from AngularJs to React.
Setting up Prometheus and Grafana for monitoring your servers Jan 22, 2019 by Eddie Zaneski
How To Setup A Grafana Dashboard Step By Step Nov 5, 2019
Business Dashboards with Grafana and MySQL
Grafana at CERN by Borja Garrido Bear
What we Learned Integrating Grafana with Prometheus
Grafana Loki: Like Prometheus, But for logs by Tom Wilkie (@tom_wilkie), Grafana Labs CNCF [Cloud Native Computing Foundation]
Using Prometheus and Grafana for Monitoring my Power Usage Grafana
Using Postgres, Prometheus and Grafana for Storing, Analyzing and Visualizing Metrics by Erik Nordstrom from TimescaleDB
What we Learned Integrating Grafana with Prometheus Mar 1, 2018 by Dimitri Vanoverbeke from Percona
What Does Kubernetes Look Like? Performance Monitoring and Visualization with Grafana by Jacob Lisi
Automating Grafana Dashboards with Jsonnet Grafana
Weather, Power, and Market Forecasts with Grafana by Max Von Roden & Steffen Knott Mar 23, 2018
Workshop: Writing React Plugins by Terkel
Workshop: Grafana Plugin Showcase, Part 1 Workshop: Grafana Plugin Showcase, Part 2 Grafana
Workshop: Become a contributor - Get started developing Grafana Grafana
Social Media
As of Feb. 14, 2020:
- Gitter chat
- 2,522 follow @grafana on Twitter
- 243,522 follower it on LinkedIn
- 137,569 people follow its Facebook
-
Get release notices via User group is on Google Groups at
https://groups.google.com/forum/#!forum/go-cd - Subscribe to “The Pipeline” bi-monthly newsletter with continuous delivery news and events.
References about Grafana
https://grafana.com/blog/2022/06/06/grafana-dashboards-a-complete-guide-to-all-the-different-types-you-can-build/
-
Free Grafana Complete course for beginners by I.T Security Labs
https://thenewstack.io/why-you-want-easy-to-setup-grafana-dashboards/
https://www.youtube.com/watch?v=Xj-TwAZtWHQ ELI5 - What I Learned Teaching Grafana to My Kids Grafana
https://www.youtube.com/watch?v=4qpI4T6_bUw How To Setup A Grafana Dashboard Step By Step SQL4automation
https://www.youtube.com/watch?v=oPumWaoNw5s&list=RDLVoPumWaoNw5s&start_radio=1&rv=oPumWaoNw5s Playlist: Guide to Grafana 101: Getting Started With (Awesome) Visualizations by Grafana Dev Evangelist Avthar Sewrathan
https://www.youtube.com/watch?v=w-c3KYKQQfs Grafana Tutorial For Beginners | Continuous Monitoring With Grafana | DevOps Training by edureka!
https://www.youtube.com/watch?v=2kb_h6OVzlc&t=158s https://grafana.com/grafana/dashboards/12023-pfsense-system-dashboard/ to monitor pfSense that relies on influx and Telegraf, from https://github.com/VictorRobellini/pfSense-Dashboard
More on DevOps
This is one of a series on DevOps:
- DevOps_2.0
- ci-cd (Continuous Integration and Continuous Delivery)
- User Stories for DevOps
- Git and GitHub vs File Archival
- Git Commands and Statuses
- Git Commit, Tag, Push
- Git Utilities
- Data Security GitHub
- GitHub API
- Choices for DevOps Technologies
- Pulumi Infrastructure as Code (IaC)
- Java DevOps Workflow
- AWS DevOps (CodeCommit, CodePipeline, CodeDeploy)
- AWS server deployment options
- Cloud services comparisons (across vendors)
- Cloud regions (across vendors)
- Azure Cloud Onramp (Subscriptions, Portal GUI, CLI)
- Azure Certifications
- Azure Cloud Powershell
- Bash Windows using Microsoft’s WSL (Windows Subsystem for Linux)
- Azure Networking
- Azure Storage
- Azure Compute
- Digital Ocean
- Packer automation to build Vagrant images
- Terraform multi-cloud provisioning automation
-
Hashicorp Vault and Consul to generate and hold secrets
- Powershell Ecosystem
- Powershell on MacOS
- Jenkins Server Setup
- Jenkins Plug-ins
- Jenkins Freestyle jobs
- Docker (Glossary, Ecosystem, Certification)
- Make Makefile for Docker
- Docker Setup and run Bash shell script
- Bash coding
- Docker Setup
- Dockerize apps
- Ansible
- Kubernetes Operators
- Threat Modeling
- API Management Microsoft
- Scenarios for load
- Chaos Engineering