

Collect metrics (for visualization by Grafana), analyze using PromQL coding, and identify alerts, especially for Kubernetes (also from CNCF).
![]()
![]()
![]()
![]()
![]()
![]()
![]()
![]()
![]()
![]()
![]()
![]()
![]()
Overview
- How it works
- Competitors
- Prometheus Origins
- PCA Exam
- Courses
- Sample app
- Unpack it.
- Homebrew on macOS install
- Docker
- Monitoring Kubernetes
- Prometheus on Kubernetes
- Starting Prometheus in Docker
- Graphing specs
- alertmanager server
- Local start
- Ansible installer
- App Metrics
- graph
- App Instrumentation
- Metrics exposition
- Exporters
- AWS
- Metric types
- Operator
- PromQL Query Language
- Alerting Rules
- Resources
- Other notes
- /tsdb_status
- Resources
- More on Security
This is a deep dive into getting started using Prometheus in enterprise production.
How it works
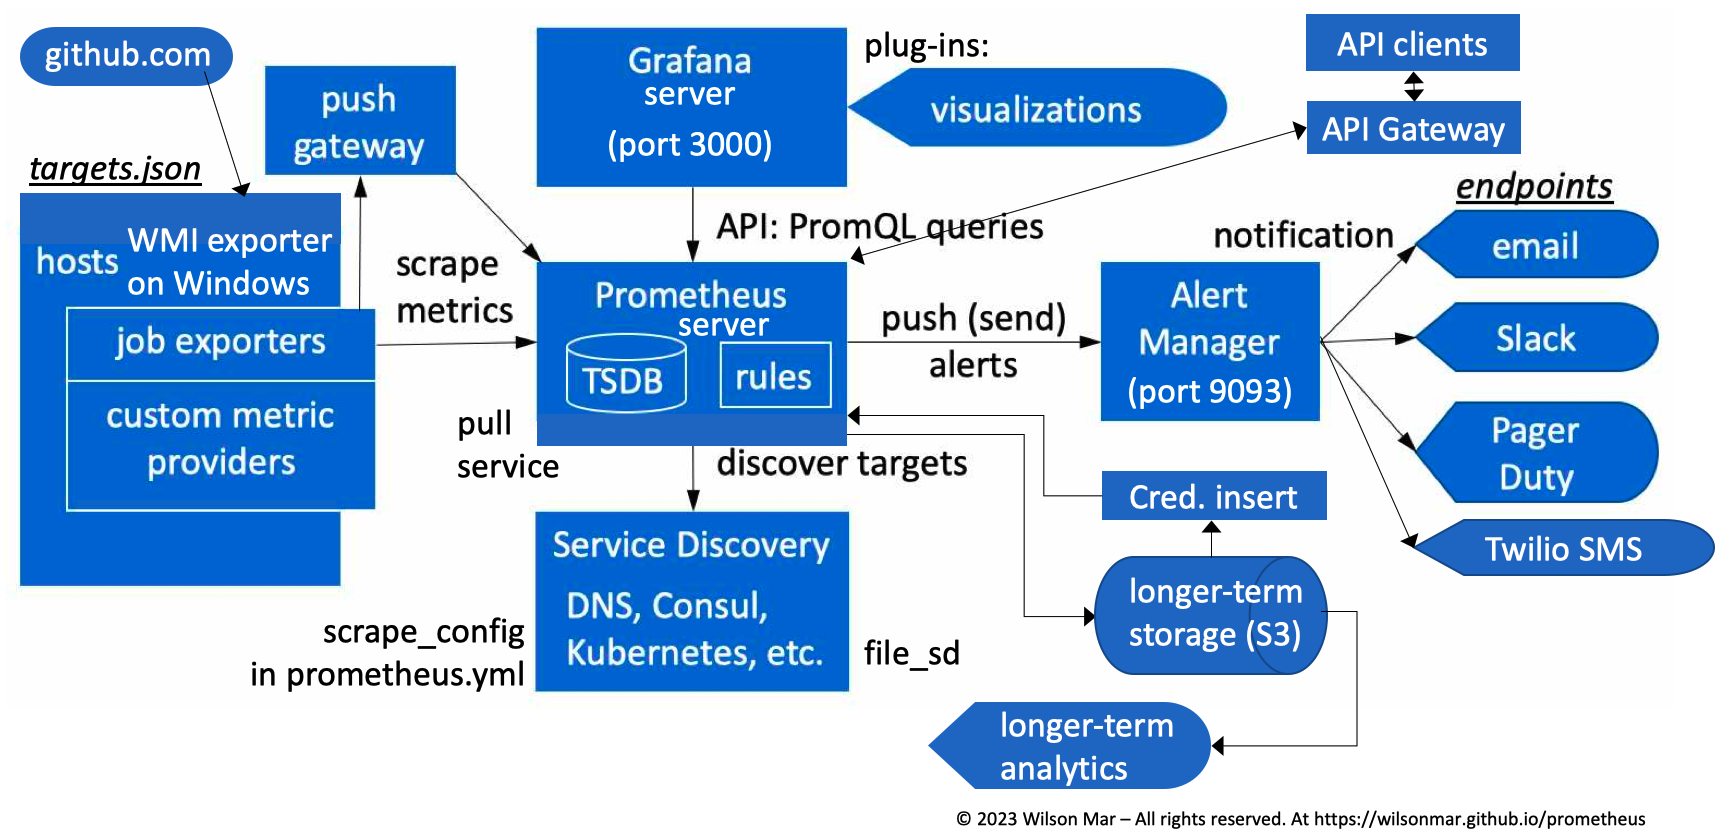
From the PowerPoint file animations used to create this VIDEO and diagram:
-
The core component of Prometheus is a server service. (written in Golang), so there are no additional VM installs like with Java, Python, etc.
-
Installers for Prometheus have been created in Homebrew for macOS, Ubuntu, and Windows. Commands to invoke them, along with sample configuration files are in a sample project GitHub repo.
-
Prometheus is configured by editing the prometheus.yaml file. One comes with the installer, but you should have a customized file in each app github repo. Start the server.
-
The Prometheus server sends HTTPS GET requests to scrape (pull) metrics from target hosts defined in its targets.json file. In addition to statically-defined targets,
A single Prometheus server can handle up to 1,000 scrape targets.
-
Targets can be discovered by Service Discovery such as DNS, Kubernetes Services, or HashiCorp Consul services. The frequency of scraping and other settings are defined in the prometheus.yml file.
-
Each target interacts with Prometheus through a job exporter service installed on each host. There is a WMI exporter on Windows and a type of exporter on Linux, etc.
-
This can be done via an intermediary push gateway for short-lived jobs.
-
Exporters reference custom metric providers which expose specific metrics.
-
Unlike the legacy statsd daemon which is concerned only with system-level metrics such as CPU, Memory, etc., the tool Prometheus (at https://prometheus.io) gathers metrics from targets at the cluster, node, and microservice API levels.
NOTE: A single Prometheus server can handle up to 1,000 scrape targets, at 100,000+ samples per second. But for larger deployments, multiple Prometheus servers can be deployed in a federated architecture, with a root Prometheus server scraping data from the child servers.
-
Prometheus stores scraped samples locally in its own multi-dimensional numeric time-series database (TSDB).
-
Rules defined in the Prometheus TSDB can be defined with filtering and aggregate new time series from data.
Each Prometheus server runs distributed standalone so thus not dependent on network storage or other remote services. So it’s available even when other parts of the infrastructure are broken.
PROTIP: Data on Prometheus servers should be considered short-lived (temporary) because data on it can be lost if the server is restarted.
-
Prometheus exposes its time-series data to a variety of API clients making PromQL (Prometheus Query Language) statements which extract data.
-
Many enterprises have API clients go through an API Gateway to enforce strong authentication and traffic limits from specific users.
-
Data on Prometheus should be frequently sent to a long-term storage system such as AWS S3, InfluxDB, Elasticsearch, Microsoft Fabric, etc.
PROTIP: Sending operational data to a central enterprise repository would enable a central SOC (Security Operations Center) to correlate events from throughout the enterprise and outside the enterprise. This approach does require diligence at managing disk space and retention.
-
PROTIP: To minimize training and confusion, enterprise organizations typically have a preferred set of tools for analytics processing to generate graphs and dashboards for visualization.
-
The same vendor who created Prometheus also created Grafana to present dashboards to visualize data.
NOTE: Grafana can also be used to visualize data from other sources such as
- InfluxDB,
- Elasticsearch,
- Microsoft Fabric running Cosmos DB, etc.
-
PROTIP: When using S3, by default, Prometheus references a static file of long-lived credentials for authentication. To prevent compromise, many organizations use a Credentials insert utility such as HashiCorp Vault which dynamically creates a new set of S3 credentials every time before running the backup.
-
PROTIP: Cloud storage mechanisms have a backup mechanism to restore data in case of failure. Practice restoring data to a new server to ensure that the backup mechanism actually works.
-
NOTE: The Prometheus server can be configured to read data from remote sources – perform remote read.
-
Because people can’t be always watching dashboard screens, Alerting Rules are set to trigger alerts pushed to the Alert Manager which forwards to various end-points such as email, Slack, Pager Duty, SMS, OpsGenie, or other notification mechanisms.
NOTE: In a HA configuration, alerts are sent to multiple Alert Managers (with different external labels -a and -b), which deduplicate and fan out alerts to their configured receivers.
-
PROTIP: To minimize training and confusion, enterprise organizations typically have a preferred set of tools for analytics processing to generate graphs and dashboards for visualization.
QUESTION: Prometheus does not collect event data from operating systems or logs emitted from applications.
The for each Prometheus:
- /status = Run-time and build information
- /flags = Command-line flags and their values
- /config = The currently loaded configuration
-
/rules = Rule evaluation states
- /target = Scrape status information for all active targets
- /service-discovery = Service discovery status information
- /tsdb-status = TSDB status information
Competitors
Prometheus is born of the cloud age which can accommodate large databases. Prometheus stores data in a standalone time series database that passively store metrics.
Prometheus differs from previous fault-detection systems, like Nagios, which run periodic check scripts but keep little historical data. Prometheus saves historical data in a Time Series Data Base (TSDB).
NOTE: The “TIK” stack (Telegraf + InfluxDB + Grafana):
-
Data Collection: Prometheus is a pull-based system where it collects data by pulling metrics from targets. On the other hand, Telegraf supports both pull and push mechanisms. It can collect data by pulling metrics from various sources as well as pushing metrics to different destinations.
-
Scalability: Prometheus is designed to be highly scalable and can handle large amounts of data. It achieves scalability through a federated architecture where multiple Prometheus servers can be federated together. Telegraf, on the other hand, is a lightweight collector that can be deployed on a large number of machines, making it highly scalable as well.
-
Data Processing: Prometheus comes with its own query language called PromQL, which allows advanced querying and processing of metrics. With PromQL, users can perform aggregations, filtering, and math operations on the collected data. Telegraf, on the other hand, focuses more on data collection and routing, leaving the data processing task to other tools in the stack.
-
Plugin Ecosystem: Telegraf has a rich plugin ecosystem, which allows easy integration with various systems and technologies. It supports a wide range of input and output plugins, making it flexible and extensible. Prometheus, on the other hand, focuses more on the core monitoring and alerting functions and has a limited number of official plugins.
-
Alerting: Prometheus has a built-in alerting system that allows users to define alert rules based on the collected metrics. It supports various notification channels, such as email, Slack, and PagerDuty, to send alerts when certain conditions are met. Telegraf, on the other hand, does not have a built-in alerting system and relies on other tools in the monitoring stack for alerting functionality.
There are also Elasticsearch, Datadog, and other SIEM paid solutions.
Prometheus Origins
“Prometheus” is, in Ancient Greek mythology, a Titan of forethought, fire, and crafty counsel – an immortal servant of the gods. He stole fire and gave it to humankind. This changed the human race forever (for better and worse). But this made mankind dangerous to the gods.
Ridley Scott named his 2012 film “Prometheus”, saying: “It’s the story of creation; the gods and the man who stood against them.”
VIDEO:
https://prometheus.io/docs/introduction/overview/
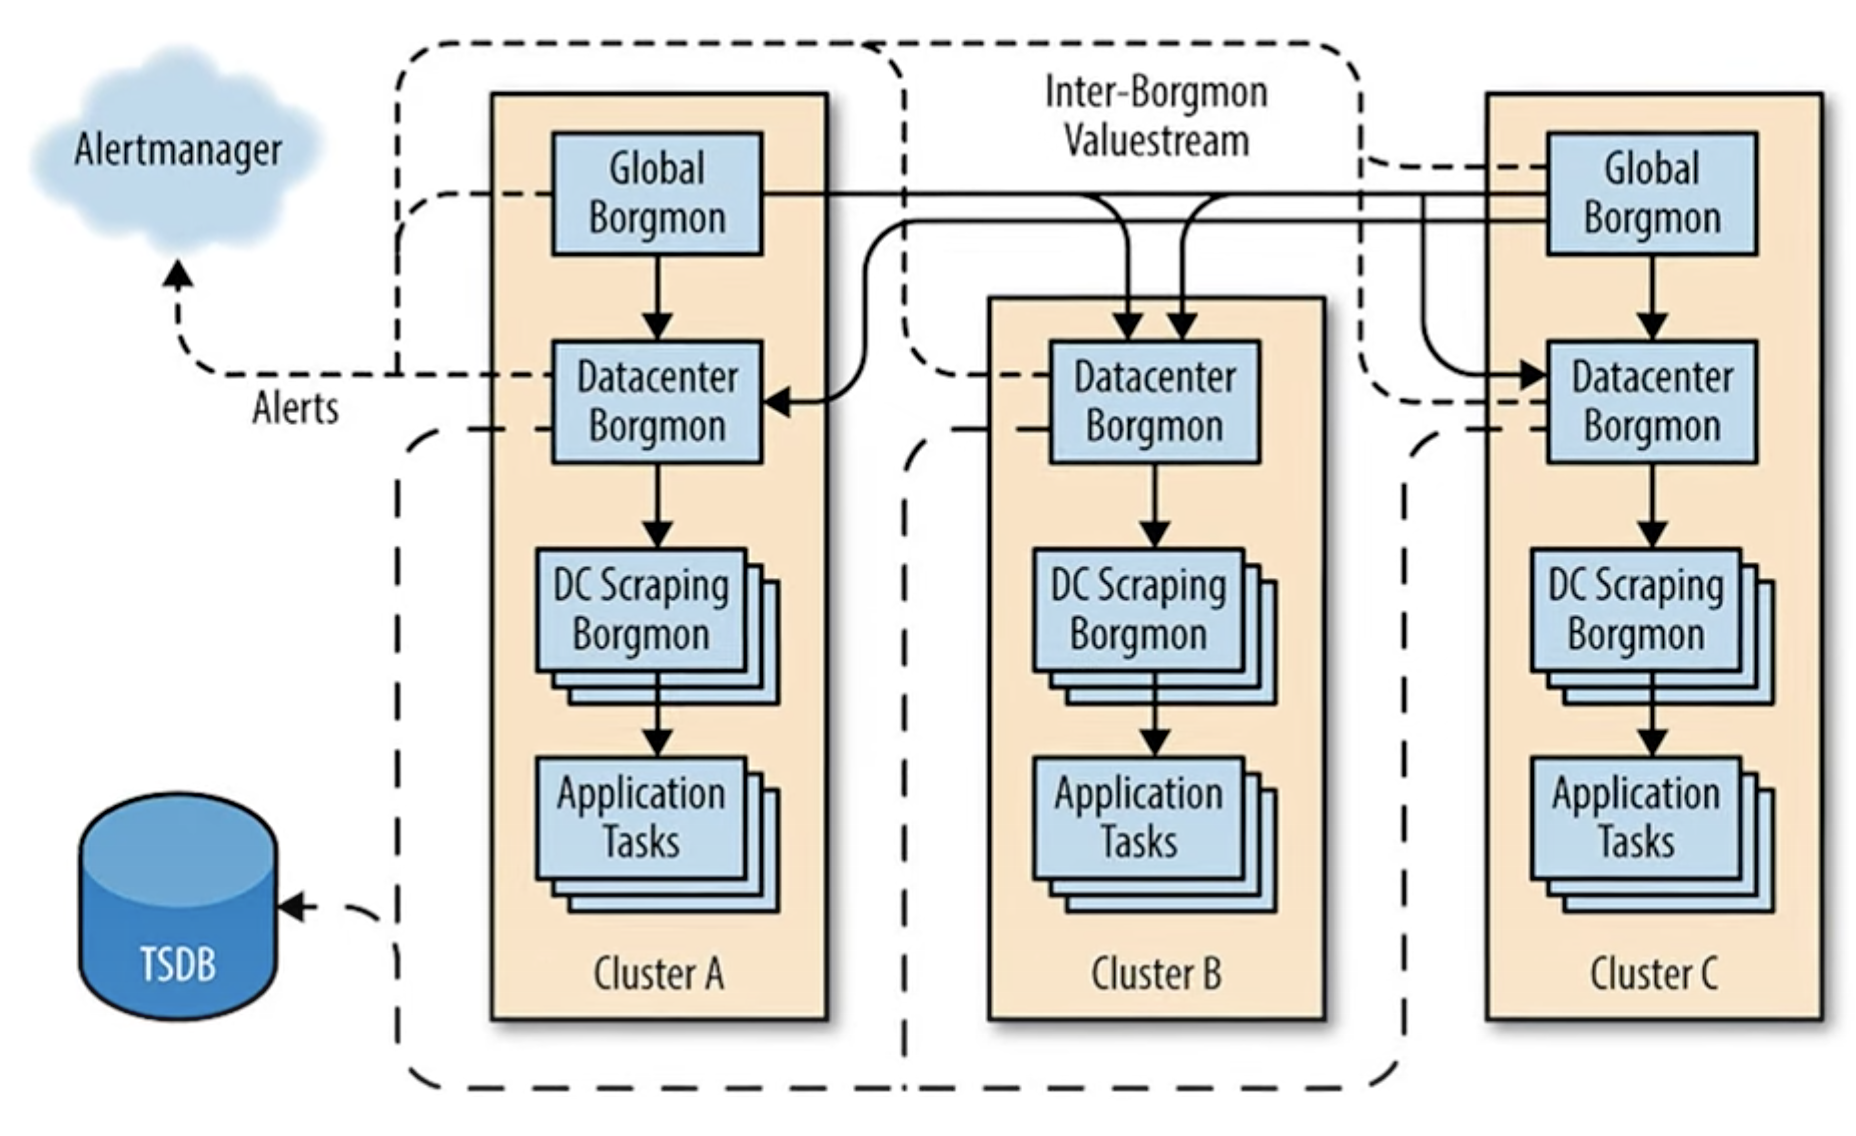
The software named Prometheus began at SoundCloud in 2012, where ex-Google SREs (Site Reliability Engineers) adopted Google’s Borgmon.
Prometheus was open-sourced in 2015 at https://github.com/prometheus/prometheus/releases
Prometheus joined the CNCF (Cloud Native Computing Foundation) in 2016 as its second hosted project after Kubernetes. So as would be expected, Prometheus works with K8s.
PCA Exam
CNCF is under the Linux Foundation, which offers the $250 Prometheus Certified Associate (PCA) exam for beginners who (with one retake) in 90-minutes answer 75% of 60 questions correctly around these domains:
18% Observability Concepts
- Metrics
- Understand logs and events
- Tracing and Spans
- Push vs Pull
- Service Discovery
- Basics of SLOs, SLAs, and SLIs
20% Prometheus Fundamentals
- System Architecture
- Configuration and Scraping
- Understanding Prometheus Limitations
- Data Model and Labels
- Exposition Format
28% PromQL
- Selecting Data
- Rates and Derivatives
- Aggregating over time
- Aggregating over dimensions
- Binary operators
- Histograms
- Timestamp Metrics
16% Instrumentation and Exporters
- Client Libraries
- Instrumentation
- Exporters
- Structuring and naming metrics
18% Alerting & Dashboarding
- Dashboarding basics
- Configuring Alerting rules
- Understand and Use Alertmanager
- Alerting basics (when, what, and why)
References:
- https://docs.linuxfoundation.org/tc-docs/certification/important-instructions-pca
- https://docs.linuxfoundation.org/tc-docs/certification/frequently-asked-questions-pca
- https://trainingportal.linuxfoundation.org/learn/course/prometheus-certified-associate-pca/exam/exam
- https://medium.com/@onai.rotich/prometheus-certified-associate-a-comprehensive-guide-9c51638578d2
Candidate Handbook reference the PSI BRIDGE Proctoring platform.
Courses
Linux Foundation developed a 2018 course.
VIDEO: Prometheus co-founder Julius Volz (in Berlin, Germany) authored the Linux Foundation’s 2018 course which is now dated. So he created promlabs.com to offer a $349 video training on Prometheus monitoring fundamentals, tutorials, quizzes, tips, and best practices. It’s based on Ubuntu Linux 20.04. Julius also built Promlens query builder.
KodeKloud
https://kodekloud.com/courses/prometheus-certified-associate-pca KodeKloud PCA Certification Course
OReilly.com
If you have a subscription to OReilly.com:
-
Sander van Vugt has a video course on Kubernetes and Cloud Native Associate (KCNA) published by Pearson IT Certification. He also has a live course 6-10am MT Dec 1 & 2, 2022.
-
11 hour Hands-On Infrastructure Monitoring with Prometheus 2019 by Joel Bastos, Pedro Araujo
By Bipin:
- Prometheus Certified Associate (PCA) Exam Study Guide by Bipin Upadhyay, who has a LinkedIn profile and blog at DevOpsCube.com.
- Setup Prometheus on Linux
By Sean Bradley:
- 4-hour “Prometheus and Grafana - Monitoring Docker Containers” video course on Udemy Jan 2024.
By Alex Philip:
-
Install on macOS (here below) his Setup Prometheus stack using Docker Compose within AWS December 2, 2023 referencing folder 04-prometheus-observability-stack within
https://github.com/techiescamp/devops-projects. ├── CODE_OF_CONDUCT.md ├── CONTRIBUTING.md ├── LICENSE ├── Makefile ├── README.md ├── SECURITY.md ├── alertmanager │ └── alertmanager.yml ├── docker-compose.yml ├── prometheus │ ├── alertrules.yml │ ├── prometheus.yml │ └── targets.json └── terraform-aws ├── README.md ├── modules │ ├── ec2 │ │ ├── main.tf │ │ ├── outputs.tf │ │ ├── user-data.sh │ │ └── variables.tf │ └── security-group │ ├── main.tf │ ├── outputs.tf │ └── variables.tf ├── prometheus-stack │ ├── main.tf │ ├── outputs.tf │ └── variables.tf └── vars └── ec2.tfvars
By Edward Viaene and Jorn Jambers:
- On Udemy, 4-hour “Prometheus and Grafana - Monitoring Docker Containers” video course. They show install of Xinial Ubuntu within Digital Ocean’s cloud.
Pluralsight
On Pluralsight.com, the tale their Skill IQ after their 9-hour Event Monitoring and Alerting with Prometheus path of 4 courses.
By Elton Stoneman (sixeyed.com):
- Getting Started with Prometheus Jun 23, 2020 shows use of a Windows machine .NET Core web app that has an optional “slow” response specification.
docker run -d -p 8080:80 --name web sexeyed/prometheus-demo-web:windows
By Chris Green (direct-root.com):
- Configuring Prometheus 2 to Collect Metrics July 13, 2021
- Building Dashboards from Prometheus Data in Grafana Oct 25, 2021
- Running Prometheus in Production Aug 12, 2021
By Craig Golightly (seethatgo.com):
- Monitoring Key Systems with Prometheus Exporters
- Alerting on Issues with Prometheus Alertmanager Feb 24, 2021
By Marcos Souza:
- https://github.com/ACloudGuru-Resources/DevOps-Monitoring-Deep-Dive
By Elle Krout:
- The 12-hour “DevOps Monitoring Deep Dive” video course references an interactive Lucid diagram called “ProjectForethought” for the NodeJs simple to-do list program called Forethought that is the subject of monitoring.
Others:
walidshaari/PrometheusCertifiedAssociate
edgarpf/prometheus-certified-associate
Al-HusseinHameedJasim/prometheus-certified-associate
Sample app
The $299 course “Monitoring Infrastructure and Containers with Prometheus” (LFS241) is based on the PaC (Project Forethought) application, which is a simple to-do list program written in Node.js. It is Dockerized and deployed to a virtual machine. The application is instrumented with Prometheus client libraries to track metrics across the app.
- Course Introduction
- Introduction to Systems and Service Monitoring
-
Introduction to Prometheus
-
Installing and Setting Up Prometheus
- Basic Querying
- Dashboarding
- Monitoring Host Metrics
- Monitoring Container Metrics
- Instrumenting Code
- Building Exporters
- Advanced Querying
- Relabeling
- Service Discovery
- Blackbox Monitoring
- Pushing Data
- Alerting
- Making Prometheus Highly Available
- Recording Rules
- Scaling Prometheus Deployments
- Prometheus and Kubernetes
- Local Storage
- Remote Storage Integrations
- Transitioning From and Integrating with Other Monitoring Systems
-
Monitoring and Debugging Prometheus
-
Create within Linux Academy’s Servers in the cloud, the “DevOps Monitoring Deep Dive” distribution in a small-sized host. https://github.com/linuxacademy/content-devops-monitoring-app
- When “READY”, click the Distribution name “DevOps Monitoring Deep Dive” for details.
- Highlight and copy the Temp. Password by clicking the copy icon.
- Click “Terminal” to open another browser window.
- Type “cloud_user” to login:
- Paste the password.
- For a new password, I paste the password again, but add an additional character.
-
Again to confirm.
-
When an environment is opened, highlight and copy this command:
bash -c "$(curl -fsSL https://raw.githubusercontent.com/wilsonmar/DevSecOps/master/Prometheus/prometheus-setup.sh)"
- Copy the password to your computer’s Clipboard.
- Switch to the Terminal to paste, which runs the script.
-
Paste the password when prompted.
-
To rerun the script, discard the current instance and create a new instance.
The script is self-documented, but below are additional comments:
blackbox_exporter
This exporter actively probes target service endpoints from the outside to get Prometheus metrics.
- Julius’ Probing Services - Blackbox Exporter training:
- https://promlabs.com/blog/2024/02/06/monitoring-tls-endpoint-certificate-expiration-with-prometheus/
VERV=$(curl –silent -qI https://github.com/prometheus/blackbox_exporter/releases/latest | awk -F ‘/’ ‘/^location/ {print substr($NF, 1, length($NF)-1)}’); echo $VERV #v0.24.0 VER=${VERV:1} echo $VER wget “https://github.com/prometheus/blackbox_exporter/releases/download/$VERV/blackbox_exporter-$VER.linux-amd64.tar.gz”
Unpack it.
tar xvfz “blackbox_exporter-$VERV.linux-amd64.tar.gz”
ls blackbox_exporter-0.24.0.linux-amd64.tar.gz
Homebrew on macOS install
- Install Homebrew using my directions for configuring PATH, etc.
-
Open a Terminal, at any folder, see information about the formula:
brew info prometheus
The response at time of writing:
==> prometheus: stable 2.49.1 (bottled) Service monitoring system and time series database https://prometheus.io/ Not installed From: https://github.com/Homebrew/homebrew-core/blob/HEAD/Formula/p/prometheus.rb License: Apache-2.0 ==> Dependencies Build: gnu-tar ✘, go ✘, node ✔, yarn ✘ ==> Caveats When run from `brew services`, `prometheus` is run from `prometheus_brew_services` and uses the flags in: /usr/local/etc/prometheus.args To start prometheus now and restart at login: brew services start prometheus Or, if you don't want/need a background service you can just run: /usr/local/opt/prometheus/bin/prometheus_brew_services ==> Analytics install: 1,224 (30 days), 3,645 (90 days), 12,333 (365 days) install-on-request: 1,224 (30 days), 3,645 (90 days), 12,332 (365 days) build-error: 4 (30 days)
-
Install using the Homebrew formula:
brew install prometheus
The response at time of writing:
==> Downloading https://ghcr.io/v2/homebrew/core/prometheus/manifests/2.49.1 ######################################################################################################################################### 100.0% ==> Fetching prometheus ==> Downloading https://ghcr.io/v2/homebrew/core/prometheus/blobs/sha256:dee352f2deef862dff57a254049859095fc6e682fe702cc8f190c6aedf8543b7 ######################################################################################################################################### 100.0% ==> Pouring prometheus--2.49.1.ventura.bottle.tar.gz ==> Caveats When run from `brew services`, `prometheus` is run from `prometheus_brew_services` and uses the flags in: /usr/local/etc/prometheus.args To start prometheus now and restart at login: brew services start prometheus Or, if you don't want/need a background service you can just run: /usr/local/opt/prometheus/bin/prometheus_brew_services ==> Summary 🍺 /usr/local/Cellar/prometheus/2.49.1: 22 files, 235.2MB ==> Running `brew cleanup prometheus`... Disable this behaviour by setting HOMEBREW_NO_INSTALL_CLEANUP. Hide these hints with HOMEBREW_NO_ENV_HINTS (see `man brew`).
-
Where was it installed?
which prometheus
On an Intel with AMD architecture chip:
/usr/local/bin/prometheus
On an Apple Silicon M1/M2/M3 ARM architecture chip:
/usr/local/opt/prometheus
BTW: ./prometheus (with the ./) is run when you are in a folder containing the executable. But that’s not necessary because /usr/local is typically in the operating system $PATH environment variable.
-
Verify that the executable can be reached from any folder:
prometheus --version
Response at time of writing on an AMD machine:
prometheus, version 2.49.1 (branch: non-git, revision: non-git) build user: brew@Ventura build date: 20240115-16:56:27 go version: go1.21.6 platform: darwin/amd64 tags: netgo,builtinassets,stringlabels
-
List all the parameters, drag the right edge wider for:
prometheus --help
Response at time of writing on an AMD machine:
usage: prometheus [<flags>] The Prometheus monitoring server Flags: -h, --[no-]help Show context-sensitive help (also try --help-long and --help-man). --[no-]version Show application version. --config.file="prometheus.yml" Prometheus configuration file path. --web.listen-address="0.0.0.0:9090" Address to listen on for UI, API, and telemetry. --web.config.file="" [EXPERIMENTAL] Path to configuration file that can enable TLS or authentication. --web.read-timeout=5m Maximum duration before timing out read of the request, and closing idle connections. --web.max-connections=512 Maximum number of simultaneous connections. --web.external-url=URL The URL under which Prometheus is externally reachable (for example, if Prometheus is served via a reverse proxy). Used for generating relative and absolute links back to Prometheus itself. If the URL has a path portion, it will be used to prefix all HTTP endpoints served by Prometheus. If omitted, relevant URL components will be derived automatically. --web.route-prefix=path Prefix for the internal routes of web endpoints. Defaults to path of --web.external-url. --web.user-assets=path Path to static asset directory, available at /user. --[no-]web.enable-lifecycle Enable shutdown and reload via HTTP request. --[no-]web.enable-admin-api Enable API endpoints for admin control actions. --[no-]web.enable-remote-write-receiver Enable API endpoint accepting remote write requests. --web.console.templates="consoles" Path to the console template directory, available at /consoles. --web.console.libraries="console_libraries" Path to the console library directory. --web.page-title="Prometheus Time Series Collection and Processing Server" Document title of Prometheus instance. --web.cors.origin=".*" Regex for CORS origin. It is fully anchored. Example: 'https?://(domain1|domain2)\.com' --storage.tsdb.path="data/" Base path for metrics storage. Use with server mode only. --storage.tsdb.retention=STORAGE.TSDB.RETENTION [DEPRECATED] How long to retain samples in storage. This flag has been deprecated, use "storage.tsdb.retention.time" instead. Use with server mode only. --storage.tsdb.retention.time=STORAGE.TSDB.RETENTION.TIME How long to retain samples in storage. When this flag is set it overrides "storage.tsdb.retention". If neither this flag nor "storage.tsdb.retention" nor "storage.tsdb.retention.size" is set, the retention time defaults to 15d. Units Supported: y, w, d, h, m, s, ms. Use with server mode only. --storage.tsdb.retention.size=STORAGE.TSDB.RETENTION.SIZE Maximum number of bytes that can be stored for blocks. A unit is required, supported units: B, KB, MB, GB, TB, PB, EB. Ex: "512MB". Based on powers-of-2, so 1KB is 1024B. Use with server mode only. --[no-]storage.tsdb.no-lockfile Do not create lockfile in data directory. Use with server mode only. --storage.tsdb.head-chunks-write-queue-size=0 Size of the queue through which head chunks are written to the disk to be m-mapped, 0 disables the queue completely. Experimental. Use with server mode only. --storage.agent.path="data-agent/" Base path for metrics storage. Use with agent mode only. --[no-]storage.agent.wal-compression Compress the agent WAL. Use with agent mode only. --storage.agent.retention.min-time=STORAGE.AGENT.RETENTION.MIN-TIME Minimum age samples may be before being considered for deletion when the WAL is truncated Use with agent mode only. --storage.agent.retention.max-time=STORAGE.AGENT.RETENTION.MAX-TIME Maximum age samples may be before being forcibly deleted when the WAL is truncated Use with agent mode only. --[no-]storage.agent.no-lockfile Do not create lockfile in data directory. Use with agent mode only. --storage.remote.flush-deadline=duration How long to wait flushing sample on shutdown or config reload. --storage.remote.read-sample-limit=5e7 Maximum overall number of samples to return via the remote read interface, in a single query. 0 means no limit. This limit is ignored for streamed response types. Use with server mode only. --storage.remote.read-concurrent-limit=10 Maximum number of concurrent remote read calls. 0 means no limit. Use with server mode only. --storage.remote.read-max-bytes-in-frame=1048576 Maximum number of bytes in a single frame for streaming remote read response types before marshalling. Note that client might have limit on frame size as well. 1MB as recommended by protobuf by default. Use with server mode only. --rules.alert.for-outage-tolerance=1h Max time to tolerate prometheus outage for restoring "for" state of alert. Use with server mode only. --rules.alert.for-grace-period=10m Minimum duration between alert and restored "for" state. This is maintained only for alerts with configured "for" time greater than grace period. Use with server mode only. --rules.alert.resend-delay=1m Minimum amount of time to wait before resending an alert to Alertmanager. Use with server mode only. --alertmanager.notification-queue-capacity=10000 The capacity of the queue for pending Alertmanager notifications. Use with server mode only. --query.lookback-delta=5m The maximum lookback duration for retrieving metrics during expression evaluations and federation. Use with server mode only. --query.timeout=2m Maximum time a query may take before being aborted. Use with server mode only. --query.max-concurrency=20 Maximum number of queries executed concurrently. Use with server mode only. --query.max-samples=50000000 Maximum number of samples a single query can load into memory. Note that queries will fail if they try to load more samples than this into memory, so this also limits the number of samples a query can return. Use with server mode only. --enable-feature= ... Comma-separated feature names to enable. Valid options: agent, exemplar-storage, expand-external-labels, memory-snapshot-on-shutdown, promql-at-modifier, promql-negative-offset, promql-per-step-stats, promql-experimental-functions, remote-write-receiver (DEPRECATED), extra-scrape-metrics, new-service-discovery-manager, auto-gomaxprocs, no-default-scrape-port, native-histograms, otlp-write-receiver. See https://prometheus.io/docs/prometheus/latest/feature_flags/ for more details. --log.level=info Only log messages with the given severity or above. One of: [debug, info, warn, error] --log.format=logfmt Output format of log messages. One of: [logfmt, json]PROTIP: An investment of time to get to know what parameters are available can come in handle (less stress for you) during troubleshooting.
–enable-feature=exemplar-storage enables (currently experimental) exposition format examplars.
QUESTION: server vs agent mode,
Clone Custom Project
References:
- https://prometheus.io/docs/prometheus/latest/configuration/configuration/
- Good example: https://github.com/prometheus/prometheus/blob/release-2.49/config/testdata/conf.good.yml
- Setup VSCode or whatever IDE you prefer to use.
- Setup Git global configurations, including SSH and GPG for a verified connection to GitHub.com
- Create a folder where you can clone a repo into.
-
Setup Prometheus stack using Docker Compose within AWS December 2, 2023 referencing folder 04-prometheus-observability-stack within
git clone git@github.com:techiescamp/devops-projects.git --depth 1
-
Remove other DevOps project folders not relevant: ???
-
Set upstream to the original developer (which contains several DevOps projects):
git remote upstream -add https://github.com/wilsonmar/devops-projects
-
Open VSCode within the repo folder:
cd ~/github-wilsonmar/devops-projects/04-prometheus-observability-stack/
-
Navigate
cd 04-prometheus-observability-stack/prometheus
-
Open VSCode within the repo folder:
code .
.
├── CODE_OF_CONDUCT.md
├── CONTRIBUTING.md
├── LICENSE
├── Makefile
├── README.md
├── SECURITY.md
├── alertmanager
│   └── alertmanager.yml
├── docker-compose.yml
├── prometheus
│   ├── alertrules.yml
│   ├── prometheus.yml
│   └── targets.json
└── terraform-aws
  ├── README.md
  ├── modules
  │   ├── ec2
  │   │   ├── main.tf
  │   │   ├── outputs.tf
  │   │   ├── user-data.sh
  │   │   └── variables.tf
  │   └── security-group
  │       ├── main.tf
  │       ├── outputs.tf
  │       └── variables.tf
  ├── prometheus-stack
  │   ├── main.tf
  │   ├── outputs.tf
  │   └── variables.tf
  └── vars
      └── ec2.tfvars
prometheus.yaml
-
Select file “prometheus.yml” to view/edit.
-
For comparison, a full sample file is at:
https://github.com/prometheus/prometheus/blob/release-2.49/config/testdata/conf.good.yml
The section headings:
global:
rule_files:
remote_write:
remote_read:
scrape_configs:
  - job_name: ...
alerting:
storage:
tracing:
Start Prometheus
-
Navigate to your Prometheus folder. The server references configuration files named prometheus.yml
-
At a folder containing prometheus.yaml, run the executable installed by brew:
prometheus
Alternately, to run Prometheus server using a custom config ymal file name:
./prometheus --config.file="prometheus-demo-a.yml"
ts=2024-02-04T23:14:14.593Z caller=main.go:544 level=info msg="No time or size retention was set so using the default time retention" duration=15d
ts=2024-02-04T23:14:14.593Z caller=main.go:588 level=info msg="Starting Prometheus Server" mode=server version="(version=2.49.1, branch=non-git, revision=non-git)"
ts=2024-02-04T23:14:14.593Z caller=main.go:593 level=info build_context="(go=go1.21.6, platform=darwin/amd64, user=brew@Ventura, date=20240115-16:56:27, tags=netgo,builtinassets,stringlabels)"
ts=2024-02-04T23:14:14.593Z caller=main.go:594 level=info host_details=(darwin)
ts=2024-02-04T23:14:14.593Z caller=main.go:595 level=info fd_limits="(soft=524288, hard=unlimited)"
ts=2024-02-04T23:14:14.593Z caller=main.go:596 level=info vm_limits="(soft=unlimited, hard=unlimited)"
ts=2024-02-04T23:14:14.599Z caller=web.go:565 level=info component=web msg="Start listening for connections" address=0.0.0.0:9090
ts=2024-02-04T23:14:14.600Z caller=main.go:1039 level=info msg="Starting TSDB ..."
ts=2024-02-04T23:14:14.602Z caller=tls_config.go:274 level=info component=web msg="Listening on" address=[::]:9090
ts=2024-02-04T23:14:14.602Z caller=tls_config.go:277 level=info component=web msg="TLS is disabled." http2=false address=[::]:9090
ts=2024-02-04T23:14:14.606Z caller=head.go:606 level=info component=tsdb msg="Replaying on-disk memory mappable chunks if any"
ts=2024-02-04T23:14:14.608Z caller=head.go:687 level=info component=tsdb msg="On-disk memory mappable chunks replay completed" duration=306.061µs
ts=2024-02-04T23:14:14.608Z caller=head.go:695 level=info component=tsdb msg="Replaying WAL, this may take a while"
ts=2024-02-04T23:14:14.612Z caller=head.go:766 level=info component=tsdb msg="WAL segment loaded" segment=0 maxSegment=0
ts=2024-02-04T23:14:14.612Z caller=head.go:803 level=info component=tsdb msg="WAL replay completed" checkpoint_replay_duration=635.216µs wal_replay_duration=3.530458ms wbl_replay_duration=201ns total_replay_duration=4.53585ms
ts=2024-02-04T23:14:14.617Z caller=main.go:1060 level=info fs_type=1a
ts=2024-02-04T23:14:14.617Z caller=main.go:1063 level=info msg="TSDB started"
ts=2024-02-04T23:14:14.617Z caller=main.go:1245 level=info msg="Loading configuration file" filename=prometheus.yml
ts=2024-02-04T23:14:14.783Z caller=main.go:1282 level=info msg="Completed loading of configuration file" filename=prometheus.yml totalDuration=165.456586ms db_storage=6.275µs remote_storage=4.234µs web_handler=434ns query_engine=1.108µs scrape=162.131337ms scrape_sd=29.266µs notify=24.794µs notify_sd=7.148µs rules=2.483027ms tracing=14.689µs
ts=2024-02-04T23:14:14.783Z caller=main.go:1024 level=info msg="Server is ready to receive web requests."
ts=2024-02-04T23:14:14.783Z caller=manager.go:146 level=info component="rule manager" msg="Starting rule manager..."
Pre-initialize
-
Pre-initialize all important label combinations to default values when the program first starts.
QUESTION: Julius says: When using metrics with label dimensions, the time series for any label combination will only appear in the /metrics output once that label combination has been been accessed at least once. This can cause problems in PromQL queries that expect certain series to always be present.
Debugging errors
-
If you see errors such as this:
ts=2024-02-04T23:15:42.822Z caller=notifier.go:530 level=error component=notifier alertmanager=http://127.0.0.1:9093/api/v2/alerts count=1 msg="Error sending alert" err="Post \"http://127.0.0.1:9093/api/v2/alerts\": dial tcp 127.0.0.1:9093: connect: connection refused"
ts=2024-02-04T23:16:57.812Z caller=notifier.go:530 level=error component=notifier alertmanager=http://127.0.0.1:9093/api/v2/alerts count=1 msg="Error sending alert" err="Post \"http://127.0.0.1:9093/api/v2/alerts\": dial tcp 127.0.0.1:9093: connect: connection refused"
Setup Go
My instructions on how to setup Golang
Configuration
-
Identify your client machine’s IP address:
-
Define storage location:
sudo mkdir -p /etc/prometheus
-
Estimate space usage:
size = time * sample rate * bytes per sample
-
Construct
Define where to store the TSDB:
--storage.tsdb.path
Define removal of data after this length of time:
--storage.tsdb.retention-time
Define removal of data after amount of space used (like in Splunk):
--storage.tsdb.retention-size
-
VIDEO: Verify release
curl -s localhost:9090/api/v1/status/buildinfo | python3 -m json.tool
{
"status": "success",
"data": {
   "version": "2.28.1",
   "revision": "d039c3e1c",
   "branch": "HEAD",
   "buildUser": "root@fa123cd1234",
   "buildDate": "2021-05-26T14:28:09Z",
   "goVersion": "go1.16.5"
}
}
Upgrade data
To ensure that data is not lost, the upgrade process is to stop the old Prometheus server, install the new version, and then start the new version.
-
PROTIP: Setup a symlink to the physical location of the binary using the ln (link) command:
sudo ln -s /usr/local/bin/prometheus /usr/local/bin/prometheus-2.2.0.linux-amd64/prometheus
Some prefer this to renaming the downloaded file so that multiple versions can reside on the server in case response to a vulnerability requires falling back to a previous version.
-
Define a special port for versions under test:
./prometheus --web.listen-address localhost:9091
-
Start Prometheus server gracefully:
systemct stop prometheus
-
Run:
./prometheus --config.file prometheus.yml
scrape_configs
On the Prometheus server, edit the prometheus.yml file to add a new scrape_configs section to recognize the exporter on host at 172.31.122.23:
scrape_configs:
  - job_name: "prometheus"
    metrics_path: "/metrics"
    static_configs:
    - targets:
      - "localhost:9090"
  - job_name: node
    file_sd_configs:
    - files:
      - "/etc/prometheus/file_sd/node.yml"
  - job_name: 'node_exporter'
    static_configs:
    - targets: ['172.31.122.23:9100']
Restart the Prometheus server to pick up the new configuration.
Docker
-
Confirm the creation of the existing Docker image:
docker image list
The response lists “forethought” as a Docker image.
-
List the contents of the forethought directory and subdirectories:
ls -d
-
Deploy the web application to a container. Map port 8080 on the container to port 80 on the host:
docker run –name ft-app -p 80:8080 -d forethought
-
Check that the application is working correctly by visiting the server’s provided URL.
In the script, this is done using a curl script and examining the HTML response.
-
Install
NOTE: The Terminal is inside a Dockerized Ubuntu (18.04 Bionic Beaver LTS) image. So
apt-getcommands are used to install Prometheus, Alertmanager, and Grafana.The infrastructure is monitored by using Prometheus’s Node Exporter and viewed statistic about our CPU, memory, disk, file system, basic networking, and load metrics. Also monitored are contrainers being using on virtual machines.
Once infrastructure monitoring is up and running, the basic Node.js application uses a Prometheus client libary to track metrics across the app.
Finally, add recording and alerting rules, build out a series of routes so any alerts created get to their desired endpoint.
The course also looks at creating persistent dashboards with Grafana and use its various graphing options to better track data.
Linux Metrics
https://training.promlabs.com/training/monitoring-linux-host-metrics
Monitoring Kubernetes
Prometheus joined the CNCF (Cloud Native Computing Foundation) in 2016 as its second hosted project after Kubernetes. So naturally, Prometheus works with K8s.
blank” href=”https://github.com/coreos/prometheus-operator”>https://github.com/coreos/prometheus-operator</a> and https://devops.college/prometheus-operator-how-to-monitor-an-external-service-3cb6ac8d5acb
PROTIP: Prometheus has not reached “1.0” yet so use of apt-get, yum, brew, installer packages are not recommended at this time for production use. But that hasn’t stopped many from using it in production.
$ cd /tmp
$ wget https://github.com/prometheus/prometheus/releases/download/v2.2.0/prometheus-2.2.0.linux-amd64.tar.gz
$ tar -xzf prometheus-2.2.0.linux-amd64.tar.gz

$ sudo chmod +x prometheus-2.2.0.linux-amd64/{prometheus,promtool}
$ sudo cp prometheus-2.2.0.linux-amd64/{prometheus,promtool} /usr/local/bin/
$ sudo chown root:root /usr/local/bin/{prometheus,promtool}

$ sudo mkdir -p /etc/prometheus
$ sudo vim /etc/prometheus/prometheus.yml
$ promtool check config prometheus.yml

Checking prometheus.yml
SUCCESS: 0 rule files found

$ prometheus --config.file "/etc/prometheus/prometheus.yml" &
Prometheus on Kubernetes
As with most things Kubernetes, a Helm chart can do it all:
- VIDEO: Setup Prometheus Monitoring on Kubernetes using Helm and Prometheus Operator | Part 1 - by TechWorld with Nana 2020
https://gitlab.com/nanuchi/youtube-tutorial-series/-/blob/master/prometheus-exporter/install-prometheus-commands.md
Starting Prometheus in Docker
To run Prometheus after downloading the Docker image from the “prom” account in Dockerhub:
docker run -p 9090:9090 -v /tmp/prometheus.yml:/etc/prometheus.yml prom/prometheus
Start Docker and try again if you get this error message:
docker: Cannot connect to the Docker daemon at unix:///var/run/docker.sock. Is the docker daemon running?.
The expected message is:
msg="Server is ready to receive web requests."
The location of the database and the retention period are controlled by command line options: Add –storage.tsdb.path for another path. Add –storage.tsdb.retention to specify another retention period than the default 15d (days).
-
Open a browser to see the log at:
There is no menu item to view the page.
-
Open a browser to see the Graph at the URL home page:

The above example are metrics for the Go language/virtual machine running locally.
NOTE: https://prometheus.io/docs contains docs. It says in 2012 SoundCloud wrote Prometheus in Golang and open sourced it at https://github.com/prometheus.
Graphing specs
-
TODO: Select “go_gc_duration_seconds” for the median, which is 50th quantile, specified as:
rate(prometheus_tsdb_head_samples_appended_total[1m])
Also:
go_gc_duration_seconds{instance="localhost:9090",job="prometheus",quantile="0.5"} - Press Execute.
-
Click “Graph”.
Notice the granularity of timing on the horizontal axis. Thousands of a second.
Configuring Prometheus.yml
-
Open a browser to
prometheus.yml is the configuration file that contains these blocks: global, rule_files, and scrape_configs. Optionally, there are remote_read, remote_write, alerting.
global:
  evaluation_interval: 15s
  scrape_interval: 15s
  scrape_timeout: 10s

 external_labels:
 environment: localhost.localdomain
In the global block, scrape_interval specifies the frequency of 15s (seconds) which Prometheus scrapes targets. (The default for this is every 60 seconds)
The /targets page shows the most recent scrape error from among all targets that cannot be scraped.
The default evaluation_interval of 15s controls how often Prometheus evaluates rule files that specify the creation of new time series and generation of alerts.
Its uniqueness is a rules engine that enables alerts by the Prometheus Alertmanager installed separately.
Rules Files
-
Open a browser to
Here are both recording rules and alerting rules.
Recording Rules
In the rule_files section are yml file names. Each yml file contains groups of recording rules that define how to periodically precompute query results as new series (with a new name) in the TSDB.
https://prometheus.io/docs/practices/rules/
Each record:</strong> in a rule is executed in the sequence defined. Each record can, optionally, have key : value labels.
The record’s expr (expression) defines how to calculate the metric.
The naming conventions for records names has three parts:
aggregation level : original metric name : aggregation type (dimensional, type of rate, etc.)
Examples:
- record: path:http_requests:rate5m expr: sum without(instance) (rate(http_requests_total{job="job1"}[5m]))- path specifies that the metric is broken up by the path label.
- rate5m specifics a 5-minute rate.
- record: instance_mode:node_cpu:rate1m expr: sum without(cpu) (rate(node_cpu_seconds_total{job="node"}[1m])) labels: my_label: my_value- “instance_mode:node_cpu:rate1m”
QUESTION: sum without(status, instance, cpu)
Referencing a precomputed series is less resource-intensive than repeated making the same calculations frequently for the same query. Instead of multiple dashboards referencing a series, recording rules can scrape metrics from one TSDB into another (to aggregate) – to federate (share) the result of a PromQL expression.
To produce alerts with a custom threshold for each path’s current error rate, use time series as alert thresholds. Define recording rules with the same output metric name, but different path label values. This enables different error rate thresholds to be synthetically recorded for each path of an HTTP-serving application. Then a single alerting rule references the generated threshold metric name.
The default interval is 1 minute. That can be changed by the global.evaluation_interval field in the Prometheus configuration file or by the rule-group-specific interval override.
According to Julius, During each rule evaluation cycle, Prometheus will:
- Evaluate the rule’s PromQL expression as an instant query at the server’s current timestamp,
- Apply label overrides (if any) to the output series,
- Apply sample output limits (if any) and fail the evaluation if the limit is exceeded,
- Store the resulting time series in the local TSDB under the provided new metric name and at the evaluation timestamp.
alertmanager server
The Prometheus Alert Manager is a separate utility server that sends alerts to various endpoints</a> when PromQL expressions in Prometheus determine when each alert needs to be sent.
REMEMBER: Alert Rules are read by the Prometheus server (not the Alertmanager).
An Alertmanager can receive alerts from several Prometheus servers. NOTE: Under development: A cluster of Alertmanager instances form a mesh configuration to ensure High Availability.
With Prometheus, Alerting, Dashboarding and adhoc querying all act from a TSDB.
alertmanager install
I’ve automated the install of with this Bash script. The latest version is automatically identified and renamed to just “alertmanager”.
run.sh
alertmanager config
In the alertmanager.yml file, define the Alertmanager server:
alerting:
alertmanagers:
- scheme: https
   static_configs:
   - targets:
      - "localhost:9093"
REMEMBER: Alertmanager uses port 9093 by default.
Docker setup
defaults:
- group_wait: 30s = how long buffer alerts in same group waits before initial notification
- group_interval: 5m = how long before new alert notification sent to group already notified
- repeat_interval: 4h = How long before re-sending notification for same alert
Alerting Rules
Based on samples from Julius and Craig:
expr (expression) is the condition which triggers the alert.
groups:
       - name: demo-alerts
  rules:
         - alert: InstanceDown
 expr: up == 0
 for: 1m
 labels:
   severity: critical
 annotations:
   summary: Instance is down
         - alert: HighErrorRate    # The name of the 2nd alert.
 expr: |                 # A PromQL expression whose output series become alerts.
   (
     sum by(path, instance, job) (
       rate(demo_api_request_duration_seconds_count{status=~"5..",job="demo"}[1m])
     )
   /
     sum by(path, instance, job) (
       rate(demo_api_request_duration_seconds_count{job="demo"}[1m])
     ) * 100 > 0.5
   )
 for: 5m                 # How long each result time series needs to be present to become a firing alert.
 labels:                 # Extra labels to attach for routing.
   severity: critical
 annotations:            # Non-identifying annotations that can be used in Alertmanager notifications.
   title: " high 5xx rate on "
   description: "The 5xx error rate for path  on  is %."
The 2nd alerting rule generates critical alerts for any path/instance/job label combinations that have an error rate larger than 0.5% for at least 5 minutes.
- group_by [‘…’] sends all [ tutorial]
A different label specify a different app/team.
- deduplication (throttling and repetition)
inhibit alerts about servers downstream if network is down.
inhibit_rules:
- source_match:
  service: 'network'
target_match:
  service: 'servers'
- silencing
QUESTION: Instead of the IP address, specify server name or code to lookup metadata using in info:</strong> entry under annotations with a GO Template</a> such as
/youpath/alertmanager/templates/custom.tmpl
QUESTION: Insert and remove server configs automatically as they are created/destroyed automatically.
severity: critical or warning
Alerts are routed to an endpoint based on the label sets defined.
https://prometheus.io/docs/alerting/latest/configuration/#receiver “We are not actively adding new receivers. We recommend implementing custom notification integrations via the webhook receiver.
Endpoints Receivers include:
- webhook [ tutorial] TODO: to Twilio to send mobile phone SMS internationally.
- email [ tutorial] TODO: Get credentials from secrets manager instead of hard-coding auth_password
- hipchat
- pagerduty
- pushover
- slack [ tutorial]
- opsgenie
- victorops
- zulip.com chat
amtool
Alertmanager doesn’t start if default route is not specified.
./amtool check-config alertmanager.yml
Scrape configs
This defines the job that scrapes the Prometheus web UI:
scrape_configs:
  - job_name: 'prometheus'
    metrics_path: "/metrics"
    static_configs:
    - targets: ['localhost:9090']
         - job_name: node
 file_sd_configs:
 - files:
   - "/etc/prometheus/file_sd/node.yml"
There can be several jobs named in a config, named x, y, and z in the sample config file.
Silence
-
When working on an issue, silence notifications.
-
When fixed, expire</strong. silence.
- Previous silenced alarts can be reactivated for a period of time.
Local start
Alternately,
PROTIP: Using /etc/prometheus would require sudo, but ~/.prometheus would not.
-
Create a folder to hold the Prometheus configuration file, then CD to it:
cd ~ ; mkdir .prometheus ; cd .prometheus
-
Create a Prometheus configuration file in the folder or copy in then edit a full template example at:
https://github.com/prometheus/prometheus/blob/release-2.3/config/testdata/conf.good.yml
-
Validate yaml syntax online:
https://github.com/adrienverge/yamllint
-
Validate for content using the promtool in the Prometheus bin folder:
promtool check config prometheus.yml
An example error message is:
Checking prometheus.yml
  FAILED: parsing YAML file prometheus.yml: yaml: line 13: did not find expected '-' indicator
The expected response is: “SUCCESS: 0 rule files found”.
-
To run Prometheus locally in the directory containing the Prometheus binary:
<pre><strong>./prometheus --config.file=prometheus.yml</strong></pre>Additional parameters, for example:
level=info ts=2017-10-23T14:03:02.274562Z caller=main.go:216 msg="Starting prometheus"...
Ansible installer
Paweł Krupa (@paulfantom, author of the Docker Workshop) and Roman Demachkovych (@rdemachkovych), together as Cloud Alchemy, defined a presentation about their Ansible role for Prometheus, with https://demo.cloudalchemy.org.
- Zero-configuration deployment
- Easy management of multiple nodes
- Error checking
-
Multiple CPU architecture support
- versioning
- system user management
- CPU architecture auto-detection
- systemd service files
- linux capabilites support
- basic SELinux (Security-Enhanced Linux) security module support
https://travis-ci.org/cloudalchemy/demo-site
Command
# Ansible managed file. Be wary of possible overwrites.
[Unit]
Description=Prometheus
After=network.target

[Service]
Type=simple
Environment="GOMAXPROCS=1"
User=prometheus
Group=prometheus
ExecReload=/bin/kill -HUP $MAINPID
ExecStart=/usr/local/bin/prometheus \
  --config.file=/etc/prometheus/prometheus.yml \
  --storage.tsdb.path=/var/lib/prometheus \
  --storage.tsdb.retention=30d \
  --web.listen-address=0.0.0.0:9090 \
  --web.external-url=http://demo.cloudalchemy.org:9090

SyslogIdentifier=prometheus                                                                                              Restart=always

[Install]
WantedBy=multi-user.target
App Metrics
The four golden signals of monitoring begins with:
-
Latency
The time it takes to service a request. It’s important to distinguish between the latency of successful requests and the latency of failed requests. For example, an HTTP 500 error triggered due to loss of connection to a database or other critical backend might be served very quickly; however, as an HTTP 500 error indicates a failed request, factoring 500s into your overall latency might result in misleading calculations. On the other hand, a slow error is even worse than a fast error! Therefore, it’s important to track error latency, as opposed to just filtering out errors.
-
Traffic
A measure of how much demand is being placed on your system, measured in a high-level system-specific metric. For a web service, this measurement is usually HTTP requests per second, perhaps broken out by the nature of the requests (e.g., static versus dynamic content). For an audio streaming system, this measurement might focus on network I/O rate or concurrent sessions. For a key-value storage system, this measurement might be transactions and retrievals per second.
To identify bottlenecks, instead of beginning with given metrics (partial answers) and trying to work backwards, the Utilization Saturation and Errors (USE) Method by Brendan Gregg (of Netflix), described at http://www.brendangregg.com/usemethod.html, begins by posing questions off a checklist, and then seeks answers. To direct the construction of a checklist, which for server analysis can be used for quickly identifying resource bottlenecks or errors.
-
Utilization
the average time that the resource was busy servicing work.
-
Errors
The rate of requests that fail, either explicitly (e.g., HTTP 500s), implicitly (for example, an HTTP 200 success response, but coupled with the wrong content), or by policy (for example, “If you committed to one-second response times, any request over one second is an error”). Where protocol response codes are insufficient to express all failure conditions, secondary (internal) protocols may be necessary to track partial failure modes. Monitoring these cases can be drastically different: catching HTTP 500s at your load balancer can do a decent job of catching all completely failed requests, while only end-to-end system tests can detect that you’re serving the wrong content.
-
Saturation
How “full” your service is. A measure of your system fraction, emphasizing the resources that are most constrained (e.g., in a memory-constrained system, show memory; in an I/O-constrained system, show I/O). Note that many systems degrade in performance before they achieve 100% utilization, so having a utilization target is essential. In complex systems, saturation can be supplemented with higher-level load measurement: can your service properly handle double the traffic, handle only 10% more traffic, or handle even less traffic than it currently receives? For very simple services that have no parameters that alter the complexity of the request (e.g., “Give me a nonce” or “I need a globally unique monotonic integer”) that rarely change configuration, a static value from a load test might be adequate. As discussed in the previous paragraph, however, most services need to use indirect signals like CPU utilization or network bandwidth that have a known upper bound. Latency increases are often a leading indicator of saturation. Measuring your 99th percentile response time over some small window (e.g., one minute) can give a very early signal of saturation.
Predictive: saturation is the basis for projections of impending issues, such as “at the current rate, your database will fill its hard drive in 4 hours.”
graph
VIDEO: Type “prometheus” for the auto-complete to show the default raw metrics built-in:
- prometheus_api_remote_read_queries
- prometheus_build_info
- prometheus_config_last_reload_success_timestamp_seconds
- prometheus_config_last_reload_successful
- prometheus_engine_queries
- prometheus_engine_queries_concurrent_max
- prometheus_engine_query_duration_seconds
- prometheus_engine_query_duration_seconds_count
- prometheus_engine_query_duration_seconds_sum
- prometheus_engine_query_log_enabled
- prometheus_engine_query_log_failures_total
- prometheus_http_request_duration_seconds_bucket
- prometheus_http_request_duration_seconds_count
- prometheus_http_request_duration_seconds_sum
- prometheus_http_requests_total
- prometheus_http_response_size_bytes_bucket
App Instrumentation
“Instrumentation” is the process of adding code to your application so it exposes metrics to Prometheus.
Prometheus scrapes metrics from apps setup to expose exposition metrics</a> through a /metrics path.
PROTIP: For insight over what is happening inside your application or library: Julius recommends direct instrumentation: track and expose Prometheus metrics directly from your own applications and services rather than using exporters for code.
-
https://www.tigera.io/learn/guides/prometheus-monitoring/prometheus-metrics/
-
https://prometheus.io/docs/practices/instrumentation/
-
https://prometheus.io/docs/instrumenting/exporters/
Video course “Instrumenting Applications with Metrics for Prometheus” by Elton Stoneman (sixeyed.com) and https://observability.courselabs.co/
The course makes use of Docker containers created
- Install Docker and Prometheus.
- Download the files. Navigate to folder 02
-
Start the servers:
docker-compose up -d
-
Logs from the web app:
docker-compose logs web
Client libraries
-
App code needs to be configured with a client library. Official and community
https://prometheus.io/docs/instrumenting/clientlibs/
Embed official client libraries:
Unofficial third-party client libraries:
-
C# .NET programs need to be configured with client libraries from:
https://www.nuget.org/packages?q=prometheus
The C# .NET .csproj file would contain:
<ItemGroup>
<Package Reference Include="prometheus-net.AspNetCore" Version="3.6.0"/>
<ItemGroup>
-
Julius has a tutorial about instrumenting his sample Go app conveniently running in GitPod:
git clone https://github.com/promlabs/go-instrumentation-exercise
https://pkg.go.dev/github.com/prometheus/client_golang/prometheus
https://pkg.go.dev/github.com/prometheus/client_golang/prometheus/promhttp
https://pkg.go.dev/github.com/prometheus/client_golang/prometheus/promauto
Initialize the Go module configuration:
go mod init instrumentation-examples
His solution branch of the repository:
git checkout instrumented -
View file docker-compose-prometheus.yaml
version: '3.7'
services:
  prometheus:
 image: psodpromapps/prometheus:m2
 build:
   context: prometheus
 ports:
   - "9090:9090"
 networks:
   - wb-net
-
The latest version:
QUESTION
-
Start Prometheus
docker-compose -f docker-compose.yaml \
-f docker-compose-prometheus.yaml up -dated
The “bag” of metrics that should all be exposed together as part of a scrape is called a “metrics registry”.
Metrics exposition
Metrics are made available from a target’s Node Exporter by exposing an unencrypted (HTTP) URL such as:
http://demo.promlabs.com:10000/metrics
Space lines added for clarity
Each metric is preceded by comments starting with “#”.
The format of the metrics exposition format (shown below) has evolved into the OpenMetrics CNCF open standard defined at https://github.com/OpenObservability/OpenMetrics, with discussions at https://groups.google.com/g/openmetrics
# HELP node uname info from the uname system call
# TYPE node_uname_info gauge
node_uname_info{domainname="(none)",machine="x86_64",nodename="localhost.localdomain",release="4.15.0-20-generic",sysname="Linux",version="#21-Ubuntu SMP Tue Apr 24 06:16:15 UTC 2018"} 1

# HELP process_open_fds Number of open file descriptors.
# TYPE process_open_fds gauge
process_open_fds 32

# HELP http_request_duration_microseconds The HTTP request latencies in microseconds.
# TYPE http_request_duration_microseconds summary
http_request_duration_microseconds{handler="prometheus",quantile="0.5"} 73334.095

# HELP dotnet_total_memory_bytes Total known allocated memory
# TYPE dotnet_total_memory_bytes gauge
# TYPE node_filefd_allocated gauge
dotnet_total_memory_bytes 363222

# HELP dotnet_collection_count_total GC collection count
# TYPE dotnet_collection_count_total counter
dotnet_collection_count_total{generation="0"} 0
dotnet_collection_count_total{generation="1"} 0
dotnet_collection_count_total{generation="2"} 0

# HELP node_filefd_allocated File descriptor statistics: allocated.
# TYPE node_filefd_allocated gauge
node_filefd_allocated 1184

# HELP node_disk_io_time_seconds_total Total seconds spent doing I/Os.
# TYPE node_disk_io_time_seconds_total counter
node_disk_io_time_seconds_total{device="sda"} 104.296

# HELP node_disk_io_now The number of I/Os currently in progress.
# TYPE node_disk_io_now gauge
node_disk_io_now{device="sda"} 0

# HELP process_virtual_memory_bytes Virtual memory size in bytes.
# TYPE process_virtual_memory_bytes gauge
process_virtual_memory_bytes 1.048576e+06

# HELP node_disk_io_time_weighted_seconds_total The weighted # of seconds spent doing I/Os.
# TYPE node_disk_io_time_weighted_seconds_total counter
node_disk_io_time_weighted_seconds_total{device="sda"} 104.296

# HELP worker_queue_length The length of the queue of pending requests.
# TYPE worker_queue_length gauge
worker_queue_length 0

# HELP worker_jobs_total Worker jobs handled
# TYPE worker_jobs_total counter
worker_jobs_tota{status="processed"} 1570222
worker_jobs_total{status="failed"} 122

# HELP worker_jobs_active Worker jobs in process
# TYPE worker_jobs_active gauge
worker_jobs_active 10

# HELP process_open_handless Number of open handles
# TYPE process_open_handless gauge
process_open_handless 10

# HELP process_cpu_seconds_total Total user and system CPU time spent in seconds.
# TYPE process_cpu_seconds_total counter
process_cpu_seconds_total 0.01
- Timestamps are 64-bit integers in millisecond precision (tenths of a second), NOT nanosecond.
-
Sample values are 64-bit floating point numbers (allowing integer precision up to 2^53). In the future, can be a values histogram.
- To colorize metrics output in browsers, install the “Prometheus Formatter” extension for Chrome and Firefox from https://github.com/fhemberger/prometheus-formatter created by fhemberger.
https://prometheus.io/docs/instrumenting/exposition_formats/
Exporters
- By Craig Golightly (seethatgo.com, @seethatgo): Monitoring Key Systems with Prometheus Exporters Aug 12, 2020
- https://prometheus.io/docs/instrumenting/exporters
Exporters are installed on servers to translate existing metrics into a format that Prometheus can scrape. Stock exporters are provided at: https://prometheus.io/download/#prometheus
PROTIP: Listed here by default port number:
- 9100 - node_exporter - more
- 9101 - HAProxy exporter
- 9102 - statsd_exporter
- 9103 - collectd_exporter (accepts collectd stats via HTTP POST)
- 9104 - mysqld_exporter setup
- 9108 - graphite_exporter
- 9110 - blackbox_exporter [class]
- 9115 - Black Box (probe metrics to host URLs)
- ???? - consul_exporter (see my notes on Consul from HashiCorp
- memcached_exporter
- ???? - jmx_exporter
- ???? - snmp_exporter
- ???? - influxdb_exporter
- MongoDB,
- PostgreSQL,
- Redis,
- haproxy_exporter has been archived.
- AWS Cloudwatch
- Azure cloud
- GCP
Pre-defined third-party exporters and software exposing Prometheus metrics are listed at
https://prometheus.io/docs/instrumenting/exporters
A whole list of 3rd-party exporters:
https://prometheus.io/docs/instrumenting/exporters/#third-party-exporters
Some third-party software components or devices cannot be instrumented directly with Prometheus-compatible metrics.
Best Practices
MySQL setup
-
For the MySQL prompt:
mysql -u root -p
- Create a database user for the exporter to use.
- Grant permissions
- Provide credentials to exporter
CREATE USER 'mysqld_exporter'@'localhost' IDENTIFIED BY 'password' WITH MAX_USER_CONNECTIONS 3;
GRANT PROCESS, REPLICATION CLIENT, SELECT ON *.* TO 'mysqld_exporter'@'localhost';
FLUSH PRIVILEGES;
export DATA_SOURCE_NAME='mysqld_exporter:password@(localhost:3306)/';
https://github.com/orgs/prometheus/projects/8 is used to track work on new exporters.
https://training.promlabs.com/training/understanding-and-building-exporters/ Create exporters on more systems.
WMI exporter on Windows
The WMI Exporter provides system metrics for Windows servers.
Setup NodeJs Exporter
Node (JavaScript) is a popular language for web apps.
Prometheus Node Explorer has its own repo at
To download a release from GitHub:
https://github.com/prometheus/node_exporter/releases
# TODO: Identify latest version URL in https://prometheus.io/download/#node_exporter
# TODO: Code different downloads for Darwin vs. other OS:
wget https://github.com/prometheus/node_exporter/releases/download/v0.16.0/node_exporter-0.16.0.linux-amd64.tar.gz
   # https://github.com/prometheus/node_exporter/releases/download/v0.16.0/node_exporter-0.16.0.darwin-386.tar.gz
   # v0.16.0 is dated 2018-05-15
tar -xzf node_exporter-*
sudo cp node_exporter-*/node_exporter /usr/local/bin/
node_exporter --version
A sample response (at time of writing):
node_exporter, version 0.16.0 (branch: HEAD, revision: 6
e2053c557f96efb63aef3691f15335a70baaffd)
. . .
The node_exporter exporter runs, by default, on port 9100 to expose metrics, but can be changed:
node_exporter --web.listen-address=":9100" \
   --web.telemetrypath="/node_metrics"
# Get the exporter tar:
wget https://github.com/prometheus/node_exporter/releases/download/v*/node_exporter-*.*linux-amd64.tar.gz
# unpack:
tar xvfz node_exporter-*.*-amd64.tar.gz
# Move into folder:
cd node_exporter-*.*-amd64
# Get menu of parms and defaults:
./node_exporter --help
# Start the exporter:
./node_exporter --web.listen-address=":9100" > node.out 2>&1
# On a client machine, Check that metrics are publishing
curl http://localhost:9100/metrics
AWS
PROTIP: In AWS S3, follow your organization’s Least-Privilege security policies by not allowing a single account all Actions for Prometheus:
- "Action": [
"s3:PutObject",
"s3:GettObject",
"s3:PutObjectAcl",
"s3:DeleteObject",
"s3:ListBucket",
"s3:GetBucketLocation"
]
Monitoring others
systems, APIs, logging, storage, hardware related, HTTP, etc.
Creating Exporters
https://prometheus.io/docs/instrumenting/writing_exporters/
Metric types
VIDEO: by Julius. Julius’ blog
-
Counters increments
VIDEO: Counters track the total number of metrics Prometheus has ingested so far: PROTIP: Metrics that keep going up and up in a graph would eventually blow up. So it’s better reported as a rate per minute. To define the 90th percentile value on a histogram:
histogram_quantile(0.9, sum by(le, path) rate(demo_api_request_duration_seconds_bucket[5m])
-
Gauges tally
Guages tally values that naturally go up and down, such as the temperature, amount of gasoline in vehicles or capacity of memory and CPU used, and the length of items in queues awaiting processing. Each guage has a maximum capacity and usually a minimum of zero.
An exposition format:
# HELP process_open_fds Number of open file descriptors.
# TYPE process_open_fds gauge
process_open_fds 15
-
histogram count of value buckets
Histograms report a count of how many were observed within each bucket of a distribution. As Prometheus receives readings such as request duration (latency), it arranges them by value in an object setup for that work.
When it comes time to publish, the value of each item observed is the basis for them to be counted within several buckets. If 6 buckets are used, the exposition would have 6 lines.
# HELP http_request_duration_seconds A histogram of the request duration.
# TYPE http_request_duration_seconds histogram
http_request_duration_seconds_bucket{le="0.025"} 20
http_request_duration_seconds_bucket{le="0.05"} 60
http_request_duration_seconds_bucket{le="0.1"} 90
http_request_duration_seconds_bucket{le="0.25"} 100
http_request_duration_seconds_bucket{le="+Inf"} 105
http_request_duration_seconds_sum 21.322
http_request_duration_seconds_count 105
We don’t want to specify buckets by the values because that changes over time. So we specify the buckets using a frequency of occurrence number between 0 and 1.0 (expressed as “+Inf” for infinity, which covers the values observed in the bucket containing the highest values). A 0.5 would cover 50% of the values.
The frequency number is specified in “le” (less than or equal to) a number to the previous bucket.
Histograms provide a count of outliers when request durations (latencies) are too slow. Alerts would trigger if the number in the highest bucket exceeds a specified occurrence.
Julius notes that when aggregating across dimensions (such as endpoint, HTTP method, etc.) use histogram rather than summary. He explains why in his tutorial.
-
Summary quartiles
“Quartiles” is a misnomer because it doesn’t really mean quarters.
Quartiles in Prometheus summary metric types are really percentiles, but specified in a 0 to 1 scale rather than 0 to 100 as normally specified in the industry.
# HELP rpc_duration_seconds A summary of RPC durations in seconds.
# TYPE rpc_duration_seconds summary
rpc_duration_seconds{quantile="0.01"} 3.102
rpc_duration_seconds{quantile="0.05"} 3.272
rpc_duration_seconds{quantile="0.5"} 4.773
rpc_duration_seconds{quantile="0.9"} 9.001
rpc_duration_seconds{quantile="0.99"} 76.656
rpc_duration_seconds_sum 5.7560473e+04
rpc_duration_seconds_count 2693
The lowest quartile may indicate durations that are too low, such as when an error occured.
To create a summary, this from Julius to specify percentiles:
requestDurations := prometheus.NewSummary(prometheus.SummaryOpts{
  Name:       "http_request_duration_seconds",
  Help:       "A summary of the HTTP request durations in seconds.",
  Objectives: map[float64]float64{
    0.5: 0.05,   // 50th percentile with a max. absolute error of 0.05.
    0.9: 0.01,   // 90th percentile with a max. absolute error of 0.01.
    0.99: 0.001, // 99th percentile with a max. absolute error of 0.001.
  },
},
)
https://prometheus.io/docs/practices/histograms/
Operator
TBD
PromQL Query Language
- https://training.promlabs.com/training/understanding-promql
Promethus provides multiple modes of graphing and dashboarding support, but also exposes its time-series data to API clients such as Grafana which makes PromQL (Prometheus query language) to extract data in order to display visualizations on their websites.
- Selecting Data
- Rates and Derivatives
- Aggregating over time
- Aggregating over dimensions
- Binary operators
- Histograms
- Timestamp Metrics
-
PROTIP: REMEMBER:
https://promlabs.com/promql-cheat-sheet/
- Selecting series
- Rates of increase for counters
-
Aggregating over multiple series
- Math between series
- Filtering series by value
-
Set operations
- Quantiles from histograms
- Changes in gauges
-
Aggregating over time
- Time
- Dealing with missing data
-
Manipulating labels
- Subqueries
-
Sample alert rule</strong> for when the per-path error rate ratios larger than a percentage:
alert: Many500Errors
# This is the PromQL expression that forms the "heart" of the alerting rule.
expr: |
  (
   sum by(path) (rate(http_requests_total{status="500"}[5m]))
 /
   sum by(path) (rate(http_requests_total[5m]))
  ) * 100 > 5
for: 5m
labels:
  severity: "critical"
annotations:
  summary: "Many 500 errors for path  (%)"
Types of metrics generated by Prometheus:
- Counter of increasing value (such as packets received)
- Gauge - a current value that increases or decreases (such as memory usage)
- Histogram is a graphical display of value dispersion
- Summary presents an overview of totals.
histogram_quantile(
  0.90,
  sum without(code,instance)(
   rate(http_request_seconds[5m])
)))
Alerting Rules
https://prometheus.io/docs/practices/alerting/
https://prometheus.io/docs/alerting/latest/alertmanager/
https://prometheus.io/docs/prometheus/latest/configuration/alerting_rules/
Resources
“Monitoring with Prometheus” is 360 pages at https://prometheusbook.com is by James Turnbull, who also wrote books about other DevOps tools: Kubernetes, Packer, Terraform, Logstash, Puppet, etc. based on his work as CTO at Kickstarter, VP of Services and Support at Docker, VP of Engineering at Venmo, and VP of Technical Operations at Puppet. The book is hands-on for Prometheus version 2.3.0 (build date 20171006-22:16:15) on a Linux distribution. However, the author promises updates even though he is busy as CTO at Empatico. Code for the book is at:
- https://github.com/turnbullpress/prometheusbook-code by the author.
- https://github.com/yunlzheng/prometheus-book is a 3rd-party Chinese translation
Turnbull suggests monitoring for “correctness”, not just their status, starting with business metrics, then application (https://landing.google.com/sre/book/chapters/monitoring-distributed-systems.html#xref_monitoring_golden-signals), then operating system metrics to avoid “cargo cult” delusions. An example is monitoring for rates of business transactions rather than server uptime.
Bryan Brazil blogs about Prometheus at https://www.robustperception.io/blog/ The blog mentions his trainings. He is working on a on Safari Book “Prometheus: Up & Running”.
paulfantom/workshop-docker
Monitoring, the Prometheus Way May 8, 2017 by Julius Volz - Co-Founder, Prometheus
Infrastructure and application monitoring using Prometheus at Devox UK May 17, 2017 by Marco Pas
LinuxAcademy video hands-on courses:
-
Monitoring Infrastructure and Containers with Prometheus: Prometheus is used to monitor infrastructure and applications at multiple levels: on the host itself, on any containers, and on the application. This hands-on lab addresses monitoring of virtual machine host and containers. It begins by setting up monitoring for a virtual machine using Prometheus’s Node Exporter. Then set up container monitoring for the provided container using Google’s cAdvisor.
View metrics in Prometheus across two levels of a system to track changes and view trends.
-
DevOps Monitoring Deep Dive by Elle Krout references an interactive Lucid diagram called “ProjectForethought” for the NodeJs simple to-do list program called Forethought that is the subject of monitoring.
Create within Linux Academy’s Servers in the cloud, the “DevOps Monitoring Deep Dive” distribution in a small-sized host. It contains a Dockerized Ubuntu (18.04 Bionic Beaver LTS).
So
apt-getcommands are used to install Prometheus, Alertmanager, and Grafana.docker run –name ft-app -p 80:8080 -d forethought
The infrastructure is monitored by using Prometheus’s Node Exporter and viewed statistic about our CPU, memory, disk, file system, basic networking, and load metrics. Also monitored are contrainers being using on virtual machines.
Once infrastructure monitoring is up and running, the basic Node.js application uses a Prometheus client libary to track metrics across the app.
Finally, add recording and alerting rules, build out a series of routes so any alerts created get to their desired endpoint.
The course also looks at creating persistent dashboards with Grafana and use its various graphing options to better track data.
Other notes
https://timber.io/blog/prometheus-the-good-the-bad-and-the-ugly/
https://eng.uber.com/m3/ Uber open-sourced their M3 Metrics platform for Prometheus in 2018 Some Uber employees went on to found Chronosphere, which is a hosted Prometheus service.
- https://chronosphere.io/resource/explainer-video-chronosphere-overview/
- https://www.youtube.com/watch?v=jIrru50I-WY
https://www.youtube.com/watch?v=h4Sl21AKiDg&pp=ygUKcHJvbWV0aGV1cw%3D%3D How Prometheus Monitoring works | Prometheus Architecture explained by TechWorld with Nana
https://github.com/akeylesslabs/helm-charts/blob/main/monitoring/akeyless-zero-trust-web-access/grafana-dashboard.yaml
https://financialit.net/news/apis/how-stash-keeping-its-platform-secure-amid-drive-integration
https://mattermost.com/blog/sloth-for-slo-monitoring-and-alerting-with-prometheus/ https://github.com/slok/sloth with Thanos ruler evaluates rules and sends alerts to Alertmanager. Prometheus and Grafana. Alertmanager integrates notifications and alerts with the Mattermost Community Server and OpsGenie.
An example of what Metrics documentation about its scrape_config looks like: https://docs-git-update-metrics-gatewaydio.vercel.app/using-gatewayd/global-configuration/metrics/
In the expression browser:
- The Graph view graphs a PromQL expression over time.
- The Table view provides a view of the output of a PromQL expression at one point in time.
/tsdb_status
The TSDB Status page shows detailed statistics about individual metric names and labels:
-
Top 10 label names with value count is used if some unintentional high-cardinality data (like public user IPs or full HTTP paths) are stored in label values, you will immediately see those problematic labels at the top here.
-
Top 10 label names with high memory usage helps to identify label names that may not have a too high number of values associated with them, but where individual values are overly large and memory-consuming.
-
Top 10 series count by metric names - to track down metric names that overall have a combination of labels attached to them that cause a large number of time series.
-
Top 10 series count by label value pairs when a specific label combination at the top here, like a histogram metric name (name=”my_histogram_bucket”) that has a lot of bucket time series attached.
Resources
https://developer.hashicorp.com/terraform/tutorials/enterprise/tfe-metrics
TechnoTim explains use of Rancher Monitoring from Helm charts in a Kubernetes cluster.
https://www.youtube.com/watch?v=TyBsKMTDl1Q Prometheus, Alert Manager, Email Notification & Grafana in Kubernetes Monitoring | Merciboi
https://www.youtube.com/watch?v=wFMEoWpVOYw Monitoring Docker Containers using Grafana & Prometheus
https://training.linuxfoundation.org/training/monitoring-systems-and-services-with-prometheus-lfs241/ $299 for 25 hours with labs: Monitoring Systems and Services with Prometheus (LFS241)
Thanos & promscale can dedup
More on Security
This is one of a series on Security and DevSecOps:
- Security actions for teamwork and SLSA
- Code Signing on macOS
- Git Signing
- GitHub Data Security
- Azure Security-focus Cloud Onramp
- AWS Onboarding
- AWS Security (certification exam)
- AWS IAM (Identity and Access Management)
- SIEM (Security Information and Event Management)
- Intrusion Detection Systems (Goolge/Palo Alto)
- SOC2
- FedRAMP
-
CAIQ (Consensus Assessment Initiative Questionnaire) by cloud vendors
- AKeyless cloud vault
- Hashicorp Vault
- Hashicorp Terraform
- SonarQube
- WebGoat known insecure PHP app and vulnerability scanners
- Security certifications
- Quantum Supremecy can break encryption in minutes
- Pen Testing
- Threat Modeling
- WebGoat (deliberately insecure Java app)