

Azure cloud SaaS (Serverless) data handling and real-time analytics using the Data Lakehouse architectural pattern. Pass the DP-600 exam.
![]()
![]()
![]()
![]()
![]()
![]()
![]()
![]()
![]()
![]()
![]()
![]()
![]()
Overview
- Architecture Diagram
- Social
- Browser Profile
- Working Home Page
- Start Trial
- Product Component “Experiences”
- Pricing
- End-to-End projects
- What’s Different?
- OneLake Shortcuts
- Delta/Parquet Format
- Personas (Fabric User Roles)
- Fabric Marketing
- Domain?
- Workspaces
- Workflow with Fabric
- Data Factory in Microsoft Fabric (DFiMF)
- DP-600 Fabric Analytic Engineer Associate
- Data Activator
- Real-Time Analytics
- Microsoft Purview
- Priva (Privacy)
- DAX Studio
- Reflex
- User Communities
- Resources
- More
This is a hands-on technical tutorial that takes you logically step-by-step to quickly learn how to setup, navigate, and use the Microsoft Fabric cloud and pass Azure certification exam
NOTE: Content here are my personal opinions, and not intended to represent any employer (past or present). “PROTIP:” here highlight information I haven’t seen elsewhere on the internet because it is hard-won, little-know but significant facts based on my personal research and experience.
BTW, don’t confuse Microsoft Fabric with “Azure Service Fabric” (a distributed systems platform that makes it easy to package, deploy, and manage scalable and reliable microservices and containers.)
Let’s dive right into the Microsoft Fabric working portal GUI:
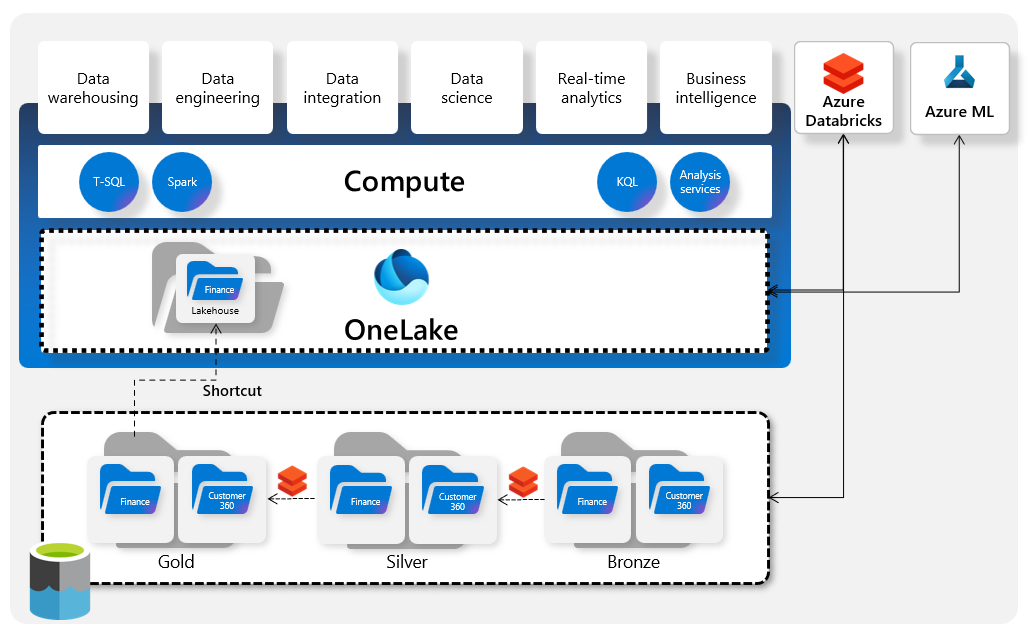
Architecture Diagram
PROTIP: I adapted the diagram below from VIDEO: The best 38-minute summary by Will Needham, Microsoft, and others to show, all in one page, relationships among key technology components in Microsoft Fabric:

Click for full-size image.
Starting from the bottom: Microsoft Fabric competes with Snowflake and Databricks, who pioneered the use of “Medallion” data processing into Parquet-formatted files which enables “schema on read” such that data can be streamed into the same database.
-
Within OneLake, data is not transferred when it’s transformed (from OLTP to OLAP). It even supports “time travel” like in GitHub source can revert entire sets of files to commit points in the past.
-
Fabric consists of four different compute engines to support the different technologies for different uses:
- A Traditional T-SQL engine to process T-SQL queries that insert data into data warehouses.
- A Spark “Big Data” engine to process PySpark jobs and Python Notebooks into Data Lakehouses.
-
Python Notebooks also generate ML (Machine Learning) models from files in OneLake
- Eventstreams add Telemetry in TSDB (Time Series Databases) which KQL (Kusto Query Language) querysets query
- A PBI Analytic engine to process DAX (Data Analysis Expressions) for calculating KPI (Key Process Indicators) on reports and dashboards.
- Reflex rules set by Data Citizens and Data Analysts using the no-code GUI Data Activator, which also fires triggers when it identifies events relevant to Reflex specs in OneLake files.
-
Shortcuts pointing to specific sets of data – good for Data Archivists to obtain to take backups.
Shortcuts are also used for Security Guards to tag data for Microsoft Purview to automatically assign permissions on data in OneLake, S3, and other file types.
-
Microsoft names GUI “Experiences” based on the role of the primary role using them:
- Data Analysts use Data Factory to run Dataflows that create and load data into OneLake files.
- Data Engineers establish Data Warehouses using “Synapse Data Warehouse”,
- establish Lakehouses using “Synapse Data Engineering”, and
- establish Telemetry databases using “Synapse Real-Time Analytics.
- Data Analysts reference established data stores to create reports and dashboards using Power BI
- Data Scientists work with Synapse Data Science to create or tune ML Models by running experiments from data in OneLake.
- Data Citizens use the no-code Data Activator to define Reflex rules that trigger actions based on various events.
-
PROTIP: For Fabric to access data in Microsoft’s CosmosDB multi-region multi-format database, there is a Sync product that mirrors the databases. Yes, this doubles the cost, like welding a new car to your old car.

VIDEO: The diagram above Greg Beaumont traces the brand names and technologies that culminated in Microsoft Fabric.
As with Databricks and Snowflake, Microsoft Fabric provides a “Medallion” architecture to go from OLTP to OLAP:
VIDEO:

Raw historical data in CSV files – Bronze – are loaded into a (Python) Spark Notebook within OneLake files to become Silver curated data accessible by a Fabric Data Warehouse view, which a Fabric Pipeline loads into a star-schema Gold (Optimized). The Metadata is used by PowerBI to create reports and dashboards.
-
Built-in Roles for Microsoft Fabric Workspace specify that:
- Admin is the only role that can “Update and delete the workspace” and “Add or remove people, including other admins”, plus all other capabilities”.
- Admin & Member are the only roles that can “Add members or others with lower permissions” and “Allow others to reshare items”.
- QUESTION:
Who can delete?
Social
https://community.fabric.microsoft.com/
https://www.reddit.com/r/MicrosoftFabric/comments/15gpjmp/bicep_in_fabric/
https://www.microsoft.com/en-us/sql-server/community?activetab=pivot:sqlservertab
https://www.meetup.com/pro/azuretechgroups/
Azure Data Community User Groups
Browser Profile
-
PROTIP: In an internet browser (Safari, Google Chrome, etc.) I click the icon next to the browser’s three-dot menu to use a browser profile that retains the browser history for the work (organizational) account I need to use with Fabric.
Working Home Page
-
REMEMBER: The Microsoft Fabric working home page has Microsoft.com and NOT Azure, at:
https://app.fabric.microsoft.com
This is because Microsoft intends Fabric to be a service that can exchange data with competing clouds such as AWS and GCP as well as on-prem. data centers (through Microsoft’s Arc). It’s a “friendamy” strategy. Fabric is how Microsoft catches up to what Snowflake and Databricks have been offering.
-
You’ll see what I call the “bouncer” page ensures that only organizational emails (work or school account) use Fabric. Your personal gmail or outlook.com account is no good here. Wow.
“You can’t sign in here with a personal account. Use your work or school account instead.”
This is why you setup a browser profiles for each email account. Click the profile icon at the top right of the browser window to switch between profiles.
If you have a license, you’ll see the fabric-landing-711x400.jpeg landing page, which lists the Fabric components you have access to.
-
Click the big round gray icon at the upper side of the Fabric page for the Admin/Sign In menu above.
Start Trial
-
Click the green Start trial box.
REMEMBER: Notice the word “capacity” instead of “instances” because Fabric is a serverless service.
-
Click “Start trial”.
PROTIP: In your Calendar, add a reminder to cancel the trial before the 30 days are up.
The trial is for the Pro tier, which is the middle tier. The Premium tier is the top tier.
We’ll come back to the “Learn more” link at: https://go.microsoft.com/fwlink/?linkid=2227617 which expands to
https://learn.microsoft.com/en-us/fabric/get-started/fabric-trial
- Select your Country (for data sovereignty) and Phone number (for SMS text verification).
-
Click Start my new trial. This creates a new Entra ID (Azure Active Directory) tenant tied to a DNS domain name to provide identity and access management (IAM) capabilities to applications and resources.
1 TB is allocated to OneLake storage.
64 capacity units (CUs) allow consumption of 64x60 CU seconds every minute when “experiences” are run.
Each data Purview Data Map capacity unit includes a throughput of 25 operations/sec and 10 GB of metadata storage limit for scanning.
PROTIP: When the capacity consumption exceeds its size, Microsoft slows down the experience similar to slowing down CPU performance.
-
VIDEO: BLOG: Monitor Capacity usage using:
-
Click the Admin icon at the top right of the page to see the number of days remaining in the trial.
Learn More
-
PROTIP: Instead of clicking this Learn more link for the “Get started” tutorial, copy the URL and switch to your personal browser profile so you get points for learning,
This article contains information from the following sources:
-
https://learn.microsoft.com/en-us/fabric/ is the main Fabric page.
- https://learn.microsoft.com/en-us/fabric/get-started/fabric-trial
-
https://learn.microsoft.com/en-us/training/paths/get-started-fabric
- https://aka.ms/Fabric-Hero-Blog-Ignite23
-

Product Component “Experiences”
PROTIP: Although Fabric is marketed as a “unified” product, practically it’s operated as a collection of products that Microsoft users navigate around.
-
Click the Microsoft Fabric icon at the bottom-left of the screen for a list of product components (without the vague marketing generalizations):

Notice that there is a group of Synapse brand data products with blue icons. Synapse is on Azure as a Platform-as-a-Service (PaaS)
DEMO: Fabric integrates into a single unified SaaS analytics platform :
- Azure Data Factory
- Azure Data Explorer
- Azure Synapse Analytics operates on workspaces containing both relational SQL databases and big-data Lake databases, all linked to blobs (files) within Azure Data Lake Storage (ADLS) Gen2
- Azure Databricks
- Azure Synapse SQL
- Power BI to
VIDEO: “Synapse Data Analytics” integrates relational data with big data, both using Azure Data Lake Storage (ADLS) Gen2, Azure Data Factory, Azure Databricks, Azure Synapse SQL, and Power BI into a single unified analytics platform.
Fabric covers the “complete spectrum” of data services including data movement, data lake, data engineering, data integration and data science, observational analytics, and business intelligence.
But what happened to products previously shown in menus:
- Azure Databricks - “Fast, easy, and collaborative Apache Spark-based analytics platform”
- Azure Data Explorer - “Fast and highly scalable data exploration service”
- Azure Synapse Analytics - “Limitless analytics service with unmatched time to insight”
- Azure Analysis Services - “Enterprise-grade analytics engine as a service”
- Azure Machine Learning - “Build, train, and deploy models from the cloud to the edge”
- Azure Stream Analytics - “Real-time analytics on fast-moving streaming data”
- HDInsight - “Provision cloud Hadoop, Spark, R Server, HBase, and Storm clusters”
- Microsoft Purview - “Govern, protect, and manage your data estate”
And Copilot? It’s a feature within Power BI. Tak Tech Analytics explains it.
Left Menus
-
 Click on any of the icons to see the left menu for that component:
Admin verify domain
-
Click the 9-dot icon at the top left of the screen present automation options: Power Automate, Power Pages, and 365 apps at
https://www.microsoft365.com/?auth=2&home=1
- Click the Admin link to designate the admin for the organizational domain name used to sign in.
- Click Next.
- Read the “See step-by-step instructions to add DNS records” about signing into the Domain Registry (such as GoDaddy) to specify a TXT record Fabric needs to use like a password to trust the domain.
- Return to Fabric and click Confirm record for “You’re now the admin”.
- Click “Go to the admin center”.
-
Finish.
Left menu common items
-
Click on Power BI on the left menu:
- Home is the landing page for the component.
- Create
- Browse
- OneLake data hub
- Monitoring hub - a station to view and track active activities across different products
- Workspaces
- My workspace
- Click the Power BI icon (at the top as it’s frequently used).
Its left menu contains what’s not in other components:
- Apps
- Metrics scorecards
- Deployment pipelines
- Learn - click on a sample to store its assets for that in your workspace, OneLake data hub, and left menu.
Install Metrics App
-
Search for other apps for Fabric at
https://appsource.microsoft.com/en-us/marketplace/apps?exp=ubp8&search=fabric&page=1
-
In PowerBI, install the Microsoft Fabric Capacity Metrics app to read:
-
Click “Get it now” at
https://appsource.microsoft.com/en-us/product/power-bi/pbi_pcmm.microsoftpremiumfabricpreviewreport?exp=ubp8
- Click “Install”.
- Click the app to go to it.
-
Connect to your own data by providing a “CapacityID” (GUID) and its UTC_offsite (time zone).
PROTIP: The capacity ID is shown in the capacity management page within the Power BI service -> Settings > Admin portal -> Capacity settings. Select a Gen2 capacity. In the URL of that page is the capacity ID. For example, “9B77CC50-E537-40E4-99B9-2B356347E584” is the Capacity ID in the URL:
https://app.powerbi.com/admin-portal/capacities/9B77CC50-E537-40E4-99B9-2B356347E584
You may first have to set your Service Principal as a Capacity Admin.
References:
- https://blog.fabric.microsoft.com/en-US/blog/capacity-metrics-in-microsoft-fabric/
- https://learn.microsoft.com/en-us/fabric/data-warehouse/usage-reporting
- https://learn.microsoft.com/en-us/fabric/admin/feature-usage-adoption
- Click “Go back” at the lower-left corner.
Each component has its own licensing considerations. See the next section.
- https://www.youtube.com/watch?v=8BAeLUywEMM by RADACAD “Why is it a big deal”.
Pricing
-
Click “Pricing” to see the Fabric Pricing page:
https://azure.microsoft.com/en-us/pricing/details/microsoft-fabric/?country=us
-
Select Region: East US (Virginia) in US Dollars by the hour.
DEFINITION: SKU = Stock Keeping Unit = a unique identifier for each distinct product and service that can be purchased in business.
PROTIP: My analysis, illustrated below, shows that while the number of CUs doubles with each level, costs also double for the two ways of charging:

Reserved CUs are 41% less than the Pay-as-you-go per-hour prices at all levels, for all countries.
As for differences in CU Reserved cost among different regions (using different colors):

PROTIP: There is only one “US” entry because prices are the same in all US regions.
Brazil South is double the cost in the US. Fabric may not even be available there because the price for Pay-as-you-go is not listed for it on the website.VIDEO: https://learn.microsoft.com/en-us/fabric/enterprise/licenses
VIDEO: A Power BI Pro license is not needed if you have a Fabric Pro license at F64 SKU or above.
https://learn.microsoft.com/en-us/power-bi/enterprise/service-premium-features
“Charges for OneLake storage are comparable to Azure ADLS of $0.023/GB on US West 2.”
End-to-End projects
*
-
VIDEO: Ways of getting Wide World Importers sample Lakehouse databases into Lakehouse:
- Fact table from a OneLake Shortcut to a blob (file)
- Order details from a Data Factory pipeline
- 2-dim tables from Excel using Dataflows
- 3-dim tables from CSV (regular uploads)
-
Darshil Parmar: Azure End-To-End Data Engineering Project to extract using an API Azure Data Factory pipline, then load into Azure Databricks storage. Then write Spark code to transform data back to Data Lake to run SQL queries.
-
VIDEO: Creating A Microsoft Fabric End-To-End Solution ⚡ [Full Course] 1h30m by Austin Libal of Pragmatic Works Jul 12, 2023. References files. Get certificate
-
https://www.youtube.com/watch?v=J4i5lcROJcs
-
https://registry.terraform.io/providers/hashicorp/azurerm/latest/docs/resources/service_fabric_cluster
https://github.com/terraform-providers/terraform-provider-azurerm/tree/master/examples/service-fabric/windows-vmss-self-signed-certs only provisions the Management. -
https://www.udemy.com/course/learn-microsoft-fabric-basic-to-advance-with-practical/
What’s Different?
Rather than other fanboys who say “it’s the latest cool thing, let’s switch now”, let’s first clear up some common confusions:
BLOG: “Microsoft Fabric can be thought of as the third generation of Microsoft data platforms, where first generation (e.g. HDInsight, SQL Data Warehouse) were somewhat isolated takes on traditional data products; Second generation was Azure Synapse Analytics, which integrated platforms at a UX level but still felt a little disjointed at the data level; and now we have Microsoft Fabric which builds upon the Synapse “unification” vision, with a particular focus on enabling deep data-level interoperability.”
The product name “Fabric” Microsoft introduced March 2023 along with a set of cloud-based product experiences containing the same words also used in legacy products that Microsoft continues to sell: BLOG:
- The “Synapse” prefix is now applied to several Fabric products. Before Microsoft Fabric, Microsoft used the “Synapse” brand for Synapse Link and the “Azure Synapse Analytics” product, which Microsoft continues to sell. PROTIP: “There is no automatic upgrade path” from Azure Synapse Analytics to Fabric Real-Time Analytics.
This “Wordly Map” (from Barry Smart at Endjin) provides a high-level overview of the evolution of products and features from “Uncharted” to “Industrial” utility in Microsoft Fabric:

-
The workspace in Azure Synapse Analytics is Synapse Studio GUI. However, Fabric uses a Power BI-based interface organized around personas — data science, data engineering, real-time analytics, etc.
-
“Mapping Data Flows” (and “Synapse Links”) are not available in Fabric.
-
“Mapping Data Flows” (and “Synapse Pipelines”) are now called “Data Flows” within Data Factory in Fabric.
PROTIP: what is so cool about Microsoft Fabric:
- OneLake Shortcuts to access any data anywhere
- OneLake DeltaFormat for time travel, streaming, and other magic with databases in all formats
- Data Activator, new to all Microsoft and the industry, for triggering automatic actions
- Access to Microsoft’s CosmosDB multi-region database involves mirroring
Individual artefacts before and after Fabric:

Justyna Lucznik explains the differences between Azure Synapse Analytics and Microsoft Fabric.
OneLake Shortcuts
Shortcuts are the most significant technical advancement with Fabric’s “OneLake” capabilities. It’s a simple but important feature.
BLOG: With Shortcuts, Microsoft enables the processing of specific datasets from “anywhere”, including blobs (files) in AWS S3 and Google Cloud Storage as well as Microsoft’s own Azure Blob Storage, Azure Data Lake Storage (ADLS) Gen2, Azure Databricks, etc.
Shortcuts enable Data Engineers to create and manage data pipelines that move data from any one place to another.
Behind the scenes, OneLake manages the various permissions and credentials to access data. Relative file paths can be used to directly read data from shortcuts. ADLS shortcuts point to the DFS endpoint for the storage account. Example:
- https://accountname.dfs.core.windows.net/...
Applications and services outside of Fabric can access Shortcuts through OneLake’s API, using enpoints such as:
- https://onelake.dfs.fabric.microsoft.com/MyWorkspace/MyLakhouse/Tables/MyShortcut/MyFile.csv
ADLS and S3 shortcut target paths can contain “-“ / “.” / “_” / “~” but not reserved characters in RCF 3986 section 2.2.
Shortcuts can be created within Microsoft’s various SQL data warehouses, lakehouses, KQL databases, etc.
PROTIP: By themselves, Shortcuts don’t “unify data across domains”. People do that by actively managing a “unified namespace” of Shortcuts across the entire enterprise. That’s hard work requiring both executive and worker support across departments and geographies. Thus the “Chief Data Officer” (CDO).
Delta/Parquet Format
Like Adobe’s PDF file format, which enabled many companies in the printing industry to flourish due to widespread adoption, the Delta Lake data format has enabled the datalake industry to achieve a whole new level. Database vendors Snowflake and Databricks have been using the Delta format for years. The storage format used by Microsoft SQL Server format was proprietary.
-
Visit:
https://www.linkedin.com/company/deltalake/
Delta Lake is an independent open-source project and not controlled by any single company. To emphasize this we joined the Delta Lake Project in 2019, which is a sub-project of the Linux Foundation Projects.
-
Visit their open-source project at:
https://github.com/delta-io
“An open-source storage framework that enables building a Lakehouse architecture with compute engines including Spark, PrestoDB, Flink, Trino, and Hive and APIs”
-
Visit their website at:
https://www.delta.io
Delta Lake is an open-source storage layer that brings ACID transactions to Apache Spark™ and big data workloads. Delta Lake runs on top of your existing data lake and is fully compatible with Apache Spark APIs.
-
Click the “Lakehouse architecture” link to see the seminal academic paper about that architectural pattern at:
https://www.cidrdb.org/cidr2021/papers/cidr2021_paper17.pdf
The seminal paper’s lead author is Michael Armbrust of Databricks (after a PhD at UC Berkeley).
Delta Lakehouse data structures are next-level genius:
-
The binary format compresses data (using algorithms Snappy, Gzip, LZ4, etc.) that’s 75% than CSV files
-
Logging of ACID transactions (changes) are enabled by Apache’s “Parquet” file format, which not only enables auditing governance but also enables time travel – bringing the whole database to specific points back in time. This is similar to what can be done with repositories of text files using Git.
-
Responds to (is fully compatible with) Apache Spark APIs to access data live
-
Share live data without copying to another system
-
Hold structured and unstructured data in the same place
-
Use a “schema-on-read” approach which define tabular schemas on semi-structured data files at the point where the data is read for analysis, without applying constraints when it’s stored, rather than legacy “schema-on-write” approach which requires data to be structured before it’s stored.
-
Contains metadata that describes the data it contains
-
Contains its own indexing mechanisms
-
multiple queries can write to the same delta table simultaneously (at exactly the same time). BLOG
-
Can handle continuous streams of data, processing video, audio, and other media data types
-
Designed to be splittable – be divided into smaller chunks for parallel processing in distributed computing frameworks like Apache Hadoop and Apache Spark.
PROTIP: The Delta format enables a revolution in how people collaborate because for once there is a “single source of truth” for data engineers, data scientists, and business analysts.
To reiterate, in the future there won’t be SSIS ETL jobs creating subsets of data to each remote department. Each department accesses the same DataLake.
Lakehouse Architecture

First generation platforms used ETL to Transform and Load data into data warehouses from which analytics reports are created. Two-tier architectures still use ETL despite using data lakes referred directly by Machine Learning systems.
Lakehouse architecture is a data management architecture that combines the analytic capabilities of data warehouses with the scale and flexibility of data lakes to support every known data workload. It is a new paradigm that enables data teams to work with any type of data, build data pipelines in any language, and use any kind of downstream analytics, business intelligence, or machine learning tool.
Combined with the wide and easy availability of disk space on hyperscalers (AWS, Azure, Google), data that used to be processed by ETL can now be processed by ELT or ELTL.
PROTIP: Microsoft’s legacy Azure ML PaaS offering is elevated by Fabric’s Synapse Data Science SaaS offering by adding access to OneCloud Delta format and the “universal” data preparation, management, and analysis tools that goes with it.
REMEMBER: Microsoft has renamed the Power BI “dataset” content type to :semantic model”. Semantics relates to the study of references, specifically describing the real meaning between symbols or words. A semantic model or semantic data model is a high-level databases. An SDM specification describes a database in terms of the kinds of entities that exist in the application environment, the classifications and groupings of those entities, and the structural interconnections among them.
-
-
Additional descriptions at:
- https://docs.delta.io/latest/delta-intro.html
- https://docs.microsoft.com/en-us/azure/databricks/delta/
For a deeper dive, get the 267-page ebook PDF “Delta Lake: Up & Running by O’Reilly at: https://www.databricks.com/resources/ebook/delta-lake-running-oreilly
https://www.databricks.com/sites/default/files/2023-10/oreilly-delta-lake_-up-and-running.pdf“Delta Lake supports several operations to modify tables using standard DataFrame APIs.”
Personas (Fabric User Roles)
Now let’s focus on impacts on the lives of people, before examining the home pages and capabilities of the products.
Instead of the traditional generic “Database Administrator” role name, Microsoft designed Fabric documentation around different roles within enterprises, listed here in order of introduction during a green-field implementation:
Data Citizens
Data Citizens are true end-users – business people who need to make decisions and take actions based on data.
They have the budget authority and the responsibility for what are correct values in databases.
PROTIP: For each set of data, there is one data owner who approves data deletion and arranges for audits as well as approving who have access and extent of permissions (for implementation by a central security team using IAM tools).
Data Citizens need to be trained to use Power BI for Analytics, Data Activator for alerts, and other tools provided by Data Analysts. Some track where they spend time on technical aspects to ensure that the time spent is worth the value of the data.
Data Analysts
Data (Business) Analysts serve the needs of Data Citizens by establishing dashboards and alerts, and training users on technologies and possibilities. These Analysts design the “data models” defining relationships among sets of data.
PROTIP: Business analysts also coordinate Chaos Engineering efforts to ensure that recovery efforts are quick and effective.
That includes coding KQL (Kusto Query Language) within Synapse Real Time Analytics to create (star schema) databases for analytics. The product is an evolution of Synapse Data Explorer, but also introduces the “Eventstreams” feature that’s very similar to Azure Stream Analytics no-code editor.
Data Analysts collaborate with Security on using Microsft Purview.
PROTIP: Those slinging legacy SSIS ETLs can add value now by enabling “Data Citizens” to use PowerBI (and Data Activator) such that they “won’t notice” (are impacted minimally) when data inevitably moves from on-prem to the Fabric cloud. Then they can brag on their resume:
“Migrated users quickly to Azure Fabric Data Activator automation with minimal disruption due to proactive restructuring of on-prem. SSIS ETLs so users access legacy visualizations and alerts from PowerBI similar to how they view data in cloud Lakehousesxx.”
Data Engineers
Data Engineers create databases (platforms):
- Move data using Data Factory
-
Organize Shortcuts to reference data files within OneLake storage
-
Program SQL within Synapse Data Warehouse to create traditional relational SQL databases
-
Program PySpark within Synapse Data Engineering to create “big data” (Hadoop-style) data lakes
- Use Data Factory to create data pipelines to move data from one place to another, such as from a data lake to a data warehouse.
Engineers also build automated workflows for monitoring, data cleaning, loading, backups, etc.
PROTIP: In response to security incidents, automation enables complete recreation of capabilities with the latest patches, rather than patching.
Microsoft’s documentation now calls “Power BI administrators” Fabric administrators.
Data Stewards/Administrators
Database Administrators are Data Stewards, data custodians responsible for protecting the organization’s most treasured assets: its data.
* Database management
* Implement Data Security
* Backups
* User Access
* Monitors performance
<br /><br />
Stewards setup and operate processes for data governance and data quality. They monitor processes for collecting data – inspecting contents to ensure that data is in the right format. They ensure that app logs, metric collections, database logs shipped, app transactions, snapshots of master data are backed up fully and as scheduled. Once a month they ensure that data can be fully and quickly restored, as measured by RTO (Recovery Time Objective) and RPO (Recovery Point Objective) SLAs. Such is an important fall-back in case of ransomware attacks.
Data stewards collaborate with others to detect and solve data corruption or mis-sychronization of data between apps and utilities.
PROTIP: In many organizations, to limit the impact of credential loss, they, after approval by the data owner, are the only accounts who can delete data which others put “in limbo”.
They use Microsoft Purview. QUESTION: Does Microsoft provide all the tools that Data Stewards need?
Data Scientists
Data Scientists work on AI models using Data Science tools such as Notebooks written in PySpark for Machine Learning. The intelligence created can be custom tags that extend generic LLM (Large Language Models) created by others for NLP (Natural Language Processing) and other AI (Artificial Intelligence) capabilities.
Data Scientists use Synapse Data Science to add embedding tags within vector databases to enhance LLMs with custom data.
Additional roles:
- Solution Architects/Architects
- AI Engineers/Architects
- Power BI data analysts
- ETL developers
- Information architects
-
DevOps Engineers/Architects
- Managers & Supervisors
- Executives: CEO, CTO, CMO, CRO, etc.
The above are used as the basis to assign permissions to the Fabric “experiences” (sub-products).
Fabric Marketing
Fabric was unveiled at Microsoft’s Build 2023 conference.
-
The marketing homepage for Fabric is:
https://www.microsoft.com/en-us/microsoft-fabric
This article covers keywords on that page: Capabilities | OneLake | Data Factory | Synapse | Data Activator | Power BI | Copilot
Other keywords:
Notebooks | Data warehouses | Dataflows | Data Pipelines | Semantic models | Reports
Domain?
Workspaces
- HANDS-ON: Explore data analytics in Microsoft Fabric from the DP-900 labs
- HANDS-ON: Explore real-time analytics in Microsoft Fabric from the DP-900 labs
-
Using the browser profile for the email you want to use,
https://app.fabric.microsoft.com
-
Click “Real Time Analytics” to see the left menu for that component:
- In the Fabric left menu, select Workspaces.
- Click the green “New workspace” button.
-
PROTIP: For Workspace Name, construct a name that includes a project name and the date, such as
RTA1-eastus2-231231a
- PROTIP: For Workspace image, construct an image file less that 45 KB to upload. Use a utility to compress an icon image around 100x100 pixels.
-
Click “Advanced” to select a licensing mode in the Advanced section that includes Fabric capacity (Trial, Premium, or Fabric).
License Mode
-
Select Pro to use basic Power BI features and collaborate on reports, dashboards, and scorecards. To access a Pro workspace, users need Pro per-user licenses.
-
Select Premium per-user to collaborate using Power BI Premium features, including paginated reports, dataflows, and datamarts. To collaborate and share content in a Premium per-user workspace, users need Premium per-user licenses. Learn more
-
Select premium capacity if the workspace will be hosted in a premium capacity. When you share, collaborate on, and distribute Power BI and Microsoft Fabric content, users in the viewer role can access this content without needing a Pro or Premium per-user license. Learn more
-
Select embedded if the workspace will be hosted in an Azure embedded capacity. ISVs and developers use Power BI Embedded to embed visuals and analytics in their applications. Learn more
-
Select Fabric capacity if the workspace will be hosted in a Microsoft Fabric capacity. With Fabric capacities, users can create Microsoft Fabric items and collaborate with others using Fabric features and experiences. Explore new capabilities in Power BI, Data Factory, Data Engineering, and Real-Time Analytics, among others. Learn more
-
Select the free trial per-user license to try all the new features and experiences in Microsoft Fabric for 60 days. A Microsoft Fabric trial license allows users to create Microsoft Fabric items and collaborate with others in a Microsoft Fabric trial capacity. Explore new capabilities in Power BI, Data Factory, Data Engineering, and Real-Time Analytics, among others. Learn more
-
-
Do not check “Develop template apps”.
-
Click “Apply” for new workspace with “There is nothing here yet”.
Create KQL database
- Click “+ New”, then “KQL database” from the dropdown.
-
PROTIP: For KQL Database name, include your project name and date:
RTA1-KQL-eastus2-231231a
-
Click “Create” to see a KQL database page.
The following is my experience trying to follow HANDS-ON: Create a KQL EventStream
-
Click “Home” icon to see the workspace page with these icons:

VIDEO: Ingesting Real-Time Data with MICROSOFT FABRIC and KUSTO
- Click the “Eventstream” icon.
-
For New Eventstream Name, construct
RTA1-KQL-stream-eastus2-231231a
- The visual designer canvas shows a source that connects to your eventstream, which in turn is connected to a destination.
- Click “New source” on the designer canvas to select “Sample data” for a “Sample data” pane.
- For “Source name”, type “taxis” and select among “Sample Data” dropdown “Yellow Taxi (high sample rate)”.
- Click “Add”.
- Select “Data preview” (on the tab beneath the designer canvas) to preview the data being streamed from the source.
-
Click “New destination” on the designer canvas to select “KQL database” for a “KQL database” entry pane.
- Leave Data Ingestion mode at default “Event processing before ingestion”.
- For “Destination name”, type “taxi-data”.
- For “Workspace”, select the one you created.
- For “KQL database”, select the one you created.
- For “Destination table”, type “taxi-data”. ???
-
Click “Add”.
-
In the Ingest data wizard, on the Destination page, select New table and enter the table name taxi-data. Then select Next: Source.
- On the Source page, review the default data connection name, and then select Next: Schema.
- On the Schema page, change the Data format from TXT to JSON, and view the preview to verify that this format results in multiple columns of data. Then select Next: Summary.
- On the Summary page, wait for continuous ingestion to be established, and then select Close.
-
Verify that your completed eventstream says “successful”.
Query real-time data in a KQL database
See https://learn.microsoft.com/en-us/azure/data-explorer/kql-quick-reference
KQL Keywords: where search take case distinct ago project extend sort Top summarize count render by and
Workflow with Fabric
Microsoft Fabric offers a centralized storage solution, eliminating data fragmentation and promoting data integrity.
Fabric aims to eliminate silos and remove data duplication by providing a single platform for collaboration among data engineers, data scientists, and business analysts. The flow is:

Databricks is a cloud-based service that provides a unified analytics platform for data scientists, data engineers, and business analysts. It provides a collaborative workspace for data scientists to build and train machine learning models. It also provides a platform for data engineers to build data pipelines and perform complex data engineering tasks. It provides a platform for business analysts to perform data analysis and build reports and dashboards. https://github.com/derar-alhussein/Databricks-Certified-Data-Engineer-Associate
- This article describes the flow in detail.
- https://learn.microsoft.com/en-us/fabric/cicd/best-practices-cicd
- Create a Fabric workspace.
-
Create a lakehouse using PowerBI. There’s no limit on the number of workspaces or items you can create within your capacity.
-
DATA SOURCE: Obtain data in a variety of formats from a variety of sources.
The end-to-end example is built using Microsoft’s Wide World Importers (WWI) sample data:
-
INGEST:
-
TRANSFORM & STORE: transform data, and load it into the lakehouse. You can also explore the OneLake, one copy of your data across lakehouse mode and SQL analytics endpoint mode.
A major innovation with lakehouses instead of data warehouse is that instead of traditional transform before load (ETL), it’s load then transform (ELT).
-
SERVE: Connect to the lakehouse’s SQL analytics endpoint to create a Power BI report using DirectLake – to analyze sales data across different dimensions.
-
CONSUME: Connect to the lakehouse’s SQL analytics endpoint to create a Power BI report using DirectLake – to analyze sales data across different dimensions.
- Optionally, orchestrate and schedule data ingestion and transformation flow with a pipeline.
-
Use Data Factory pipelines in Microsoft Fabric
Learn more:
-
Synapse Data Warehouse: support data use from SQL Endpoints.
- https://learn.microsoft.com/en-us/training/modules/get-started-data-warehouse/
- https://learn.microsoft.com/en-us/training/modules/get-started-data-warehouse/
-
Synapse Data Engineering: run Notebooks within the Spark platform for data transformation at scale.
- https://learn.microsoft.com/en-us/training/modules/use-apache-spark-work-files-lakehouse/
- https://learn.microsoft.com/en-us/training/modules/use-apache-spark-work-files-lakehouse/
-
 Synapse Data Science: model training and execution tracking in a scalable environment using Azure Machine Learning and Spark.
- https://learn.microsoft.com/en-us/training/modules/get-started-data-science-fabric/
- https://learn.microsoft.com/en-us/training/modules/get-started-data-science-fabric/
-
Synapse Real-Time Analytics: real-time analytics to query and analyze large volumes of data in real-time.
Data Factory in Microsoft Fabric (DFiMF)
- VIDEO
- Quickstart: Create an Azure Data Factory using Bicep Template Code Sample with a pipeline that copies data from one folder to another in an Azure Blob Storage, using PowerShell QuickStart templates
- Tutorial: Transform data using Spark
![]() Microsoft Fabric “Data Factory” is different from “Azure Data Factory (ADF)” that continues to be used (at lower cost).
Microsoft Fabric “Data Factory” is different from “Azure Data Factory (ADF)” that continues to be used (at lower cost).
IMPORTANT PROTIP: Some use the term “Data Factory in Microsoft Fabric (DFiMF)” to differentiate it from the legacy ADF. DFiMF adds to ADF features from Power Query Dataflows and integrates tagging for Data Governance. DEFINITION: Azure Data Factory is a service that can ingest large amounts of raw, unorganized data from relational and non-relational systems, and convert this data into meaningful information. Therefore, it’s referred to as a data integration service.
-
Data Factory: data integration pipelines to copy data and orchestrate data processing, combining Power Query Online and/or Dataflows (Gen2) to Import and transform data from 90+ data sources, and load it directly into a table in the lakehouse. Dataflows (Gen2) performs ETL tasks using Power Query Online.
- https://learn.microsoft.com/en-us/fabric/data-factory/data-factory-overview
- https://learn.microsoft.com/en-us/training/modules/use-data-factory-pipelines-fabric/
-
https://www.youtube.com/watch?v=CtTrnd-UGt8
- Why you should look
- SQLBits
- VIDEO: Azure Synapse Analytics is a combination of Azure SQL Data Warehouse and Azure Data Factory.
VIDEO: Difficulties with Data Factory include:
- Little flexibility beyond what’s available
- Difficult to create generic pipelines
- Difficult to optimize
-
Power BI: business intelligence for translating data to decisions. Power BI administrators are now Fabric administrators.
-
Data Activator: “Insight to action” takes action based on real-time changes in your data.
For example, if a trigger activates when a trend reaches a pre-defined threshold, if action is not urgent, look up people using Microsoft Graph Toolkit Playground lookalike and identify when they can meet. Then use Power Apps to populate meeting picker, identify meeting slots, and create an event. Add calls (actions) to a Power Apps custom connector that will be called from your canvas app. Schedule a Teams meeting in canvas app within Teams. Automatically send out a meeting invitation.
If the action needed is urgent, send out SMS text to those who need to know. VIDEO:
DP-600 Fabric Analytic Engineer Associate
Microsoft’s $165 DP-600 Fabric Analytic Engineer Associate exam page (available in March 2024) provides free tutorials. Study Guide
Plan, implement, and manage a solution for data analytics (10–15%)
Plan a data analytics environment:
- Identify requirements for a solution, including components, features, performance, and capacity stock-keeping units (SKUs)
- Recommend settings in the Fabric admin portal
- Choose a data gateway type
- Create a custom Power BI report theme
Implement and manage a data analytics environment
- Implement workspace and item-level access controls for Fabric items
- Implement data sharing for workspaces, warehouses, and lakehouses
- Manage sensitivity labels in semantic models and lakehouses
- Configure Fabric-enabled workspace settings
- Manage Fabric capacity
Manage the analytics development lifecycle
- Implement version control for a workspace
- Create and manage a Power BI Desktop project (.pbip)
- Plan and implement deployment solutions
- Perform impact analysis of downstream dependencies from lakehouses, data warehouses, dataflows, and semantic models
- Deploy and manage semantic models by using the XMLA endpoint
- Create and update reusable assets, including Power BI template (.pbit) files, Power BI data source (.pbids) files, and shared semantic models
Prepare and serve data (40–45%)
Create objects in a lakehouse or warehouse:
- Ingest data by using a data pipeline, dataflow, or notebook
- Create and manage shortcuts
- Implement file partitioning for analytics workloads in a lakehouse
- Create views, functions, and stored procedures
- Enrich data by adding new columns or tables
Copy data:
- Choose an appropriate method for copying data from a Fabric data source to a lakehouse or warehouse
- Copy data by using a data pipeline, dataflow, or notebook
- Add stored procedures, notebooks, and dataflows to a data pipeline
- Schedule data pipelines
- Schedule dataflows and notebooks
Transform data:
- Implement a data cleansing process
- Implement a star schema for a lakehouse or warehouse, including Type 1 and Type 2 slowly changing dimensions
- Implement bridge tables for a lakehouse or a warehouse
- Denormalize data
- Aggregate or de-aggregate data
- Merge or join data
- Identify and resolve duplicate data, missing data, or null values
- Convert data types by using SQL or PySpark
- Filter data
Optimize performance:
- Identify and resolve data loading performance bottlenecks in dataflows, notebooks, and SQL queries
- Implement performance improvements in dataflows, notebooks, and SQL queries
- Identify and resolve issues with Delta table file sizes
Implement and manage semantic models (20–25%)
Design and build semantic models:
- Choose a storage mode, including Direct Lake
- Identify use cases for DAX Studio and Tabular Editor 2
- Implement a star schema for a semantic model
- Implement relationships, such as bridge tables and many-to-many relationships
- Write calculations that use DAX variables and functions, such as iterators, table filtering, windowing, and information functions
- Implement calculation groups, dynamic strings, and field parameters
- Design and build a large format dataset
- Design and build composite models that include aggregations
- Implement dynamic row-level security and object-level security
- Validate row-level security and object-level security
Optimize enterprise-scale semantic models:
- Implement performance improvements in queries and report visuals
- Improve DAX performance by using DAX Studio
- Optimize a semantic model by using Tabular Editor 2
- Implement incremental refresh
Explore and analyze data (20–25%)
Perform exploratory analytics:
- Implement descriptive and diagnostic analytics
- Integrate prescriptive and predictive analytics into a visual or report
- Profile data
Query data by using SQL:
- Query a lakehouse in Fabric by using SQL queries or the visual query editor
- Query a warehouse in Fabric by using SQL queries or the visual query editor
- Connect to and query datasets by using the XMLA endpoint
Exam-Cram by Angie Rudduck and Wesley De Bolster
Sample Practice Test:
Data Activator
![]()
- aka.ms/DataActivatorPreview
- Exercise
- FF Analytics playlist
- Microsoft Mechanic by Will Thompson (Group Product Manager of Data Activator)
- VIDEO on Guy in a Cube channel : Will Thompson (Group Product Manager of Data Activator) provided the screen images below.
- VIDEO: Digging deeper
- What is Data Activator?
- by Justin Berry
- this blog provided the flow diagram
NOTE: Previously, Azure Synapse Pipelines had a
- Schedule Trigger,
- Tumbling Window Trigger, and
- Event-Based Trigger.
Data Activator monitors workspaces with a PowerBI Premium license.
Data Activator initiates actions based on Reflex items, each containing all the details to connect to data sources, monitor conditions. A Reflex is typically setup for each business segment or process monitored.
PROTIP: Data Activator, if it works as intended, can be a real game changer to enable Data Citizens to create “digital robots” that automatically take action rather than relying on humans constantly scanning dashboards, which can be error prone. Here’s where machines (AI or not) replace human workers – and “The Sorcerer’s Apprentice” VIDEO: fiasco becomes reality.
Data Activator runs in the background to review data created in Power BI, Synapse Real Time Analytics, Synapse Data Warehouse in OneLake to identify conditions that trigger automatic actions (in batches every 5 minutes):
- send message in Microsoft Teams,
- send appointment in Outlook, and
- Power Automate to perform logic

-
The Fabric Administrator enables a Microsoft Fabric subscription at:
-
In tenant settings, enable Data Activator for specific security groups or the entire organization except specific security groups.
-
 Within PowerBI, open a report. Click the 3 dots at the upper-right to select “Trigger action”.
-
Select the Measure, For each, time axis. Scroll down.

-
Select Every …period to refresh data, scroll down to:

-
Select What to detect value and Threshold.

-
Select Where to save Workspace & Item.
-
Click Continue to create a Reflex.
-
Click “Data Activator” for its mode tabs at the bottom of the screen: Data mode and Design mode.
- Click Data mode to inspect the fresh data and link it to specific objects.
- Click Design mode to develop triggers based on these objects.
Consider the following scenarios:
-
When a potential security breach is identified through real-time monitoring, immediate protective actions are initiated.
-
A warehouse manager needs to detect drops in product stocks and needs to start a reorder process to prevent running out of stock.
-
A sales associate needs to receive alerts when a potential client is visiting their website and offers to start a live chat with them.
Copilot, an AI-powered assistant assists users in tasks like generating SQL statements, creating reports and setting up automated workflows based on triggers. By leveraging AI capabilities, Copilot streamlines and automates data-related tasks, enabling users to work more efficiently and derive actionable insights from their data.
The Fabric engine is an upgrade from separate systems used by separate roles of people. So there is a lot of copying of data from one engine to another:

Delta (Parquet) Format
At the bottom is storage. “One Lake” is the branding for storage built on top of Azure Data Lake Storage Gen2 (ADLSg2) lakehouse that combines storage locations across different regions and clouds into a single logical lake, without moving or duplicating data (DirectLake mode).
The key enabler (for Microsoft as well as Snowflake and Databricks DeltaLake) is the Delta format (generically called “Parquet” format) that enables ACID transactions on “unstructured” data in data lakes:
-
Atomicity – each transaction is treated as a single unit, which succeeds completely or fails completely. For example, a transaction that involved debiting funds from one account and crediting the same amount to another account must complete both actions. If either action can’t be completed, then the other action must fail.
-
Consistency – transactions can only take the data in the database from one valid state to another. To continue the debit and credit example above, the completed state of the transaction must reflect the transfer of funds from one account to the other.
-
Isolation – concurrent transactions cannot interfere with one another, and must result in a consistent database state. For example, while the transaction to transfer funds from one account to another is in-process, another transaction that checks the balance of these accounts must return consistent results - the balance-checking transaction can’t retrieve a value for one account that reflects the balance before the transfer, and a value for the other account that reflects the balance after the transfer.
-
Durability – when a transaction has been committed, it will remain committed. After the account transfer transaction has completed, the revised account balances are persisted so that even if the database system were to be switched off, the committed transaction would be reflected when it is switched on again.
Previously, SQL and analytic data are stored in different database technologies.
- Introduction to end-to-end analytics using Microsoft Fabric - better collaboration between data engineers, data scientists, and business analysts. An analytical store that combines the file storage flexibility of a data lake with the T-SQL-based query capabilities of a data warehouse.
- https://learn.microsoft.com/en-us/fabric/get-started/fabric-trial
- https://learn.microsoft.com/en-us/fabric/admin/fabric-switch = Enable Fabric
- Microsoft Fabric portal at https://app.fabric.microsoft.com
- Pro, Premium needed to create a lakehouse
- Default Delta Small or Large dataset storage format
- Get started with lakehouses in Microsoft Fabric Exercise
- Describe core features and capabilities of lakehouses in Microsoft Fabric
- Dataflows (Gen2) are based on Power Query - a familiar tool to data analysts using Excel or Power BI that provides visual representation of transformations as an alternative to traditional programming.
- Ingest data into files and tables in a lakehouse.
- Query lakehouse tables with SQL. Shortcuts point to different storage accounts and other Fabric items like data warehouses, KQL databases, and external Lakehouses.
- Use Apache Spark in Microsoft Fabric
- Work with Delta Lake tables in Microsoft Fabric
- Use Data Factory pipelines in Microsoft Fabric
-
Ingest Data with Dataflows Gen2 in Microsoft Fabric
- Get started with data warehouses in Microsoft Fabric: Exercise
- Query and transform data
- Prepare data for analysis and reporting
- https://learn.microsoft.com/en-us/power-bi/transform-model/desktop-create-and-manage-relationships
- Measures are calculated fields based on the data in the tables in your data warehouse using the Data Analysis Expressions (DAX) formula language.
- Datasets are a semantic model with metrics that are used to create reports.
- Secure and monitor your data warehouse - Data in Fabric is organized into workspaces, which are used to control access and manage the lifecycle of data and services. Dynamic management views (DMVs) to monitor connection, session, and request status to see live SQL query lifecycle insights. available to use in Fabric:
- sys.dm_exec_connections: Returns information about each connection established between the warehouse and the engine.
- sys.dm_exec_sessions: Returns information about each session authenticated between the item and engine.
- sys.dm_exec_requests: Returns information about each active request in a session. item permissions in a workspace grant access to individual warehouses to enable downstream consumption of data.
- Get started with data science in Microsoft Fabric Promotion can be done by any workspace member who has been granted permissions. Certification are enabled in the tenant by the admin, and only designated certifiers can perform the endorsement.
Real-Time Analytics
- HANDS-ON: Explore data analytics in Microsoft Fabric from the DP-900 labs
- HANDS-ON: Explore real-time analytics in Microsoft Fabric from the DP-900 labs
- Q&A:
- In “Real-Time Analytics”.
-
Click “Use a sample” for this menu:

- Click “Log Analytics” to load and “RawSysLogsSample” appears in the left menu.
-
Click “Run”.
Error: Semantic error: 'take' operator: Failed to resolve table or column expression named 'DownSampledTransformedLogs'

 clientRequestId:
- Click “Metrics analytics” to load and “RawServerMetricsSample” appears in the left menu.
-
Click “Run”.
Error: Semantic error: Stored query result 'DailySQLMetrics' was not found

 clientRequestId:
-
TODO: Report errors?
-
Verify:
Check that the tables have been loaded properly by going to the “Data” section of the workspace and verifying that the tables are present.
Check that the table and column names in the queries are correct and match the names of the tables and columns in the workspace.
Try running the queries again after refreshing the page or restarting the workspace.
NOTE: Competition to Microsoft Synapse Real-Time Analytics is open-source Apache Pinot which originated from within Linkedin for user-facing real-time data analytics. StarTree.
VIDEO: Comparison: Latency. Freshness. Concurrency. Throughput. Flexibility. Cost.
Benchmarks?
Microsoft Purview
Among Microsoft’s security portfolio: Defender XDR, Entra PIM, Intune MDM, Priva, Purview DLP, Sentinel SIEM, and Azure Security Center.
https://www.microsoft.com/en-us/security/business/microsoft-purview is the marketing landing page
“Microsoft Purview is a comprehensive portfolio of products spanning data governance, data security, and risk and compliance solutions.”
- https://www.microsoft.com/en-us/security/business/microsoft-purview
- https://www.microsoft.com/en-us/security/business/microsoft-purview?rtc=1
- https://www.microsoft.com/en-us/security/business/microsoft-purview?rtc=1#data-governance
- https://www.microsoft.com/en-us/security/business/microsoft-purview?rtc=1#data-security
- https://www.microsoft.com/en-us/security/business/microsoft-purview?rtc=1#risk-compliance
- https://www.microsoft.com/en-us/security/business/microsoft-purview?rtc=1#data-governance
- https://www.microsoft.com/en-us/security/business/microsoft-purview?rtc=1#data-security
- https://www.microsoft.com/en-us/security/business/microsoft-purview?rtc=1#risk-compliance
“Microsoft Purview is a unified data governance platform that helps you manage and govern your on-premises, multi-cloud, and software-as-a-service (SaaS) data. Purview provides a unified view of your data estate by discovering and classifying your data, mapping data lineage, and enabling data protection.”
https://learn.microsoft.com/en-us/purview/purview describes features:
- Data Catalog - discover and catalog data assets
- Data Loss Prevention (DLP) - identify and protect sensitive data
- Privileged Access Management (PAM) - manage, control, and monitor access to critical assets
https://learn.microsoft.com/en-us/training/modules/intro-to-microsoft-purview/?source=recommendations
Based on https://learn.microsoft.com/en-us/purview/create-microsoft-purview-portal
Purview Account
-
Search for “Purview accounts”: https://portal.azure.com/#view/HubsExtension/BrowseResource/resourceType/Microsoft.Purview%2FAccounts
-
Click “Create Microsoft Purview account”. https://portal.azure.com/#create/Microsoft.AzurePurviewGalleryPackage
- Select the Subscription to use.
-
Select an existing Resource group or create a new one.
purview-west-us-231129a
PROTIP: A Purview account needs to be created for each Region your organization operates.
- For Microsoft Purview account name, specify the same name as the Resource Group.
-
For Location, select the same location as the Resource Group.
Notice the CU. The default is 1. The maximum is 64.
- In Tags, specify a tag “CreatedBy” with your name and email address as the Value.
-
Create for the Overview Deployment
Purview Governance Portal
-
Enter the Purview Portal:
https://web.purview.azure.com/
- Select the Directory and Purview Account (just created) for the Data catalog view.
-
Expand the left menu
- Data Catalog
- Data Map
- Data estate insights
- Data Policies
Not shown:
- Data Sources
- Data Lineage
- Data Protection
- Data Classification
- Data Discovery
- Data Governance
-
View Microsoft Purview overview at https://go.microsoft.com/fwlink/?linkid=2148717
Get Started at https://go.microsoft.com/fwlink/?linkid=2149760
Documentation at: https://go.microsoft.com/fwlink/?linkid=2148916
-
Based on “Get Started” at https://go.microsoft.com/fwlink/?linkid=2149760
Purview Risk and Compliance
-
Enter the Compliance Portal:
https://compliance.microsoft.com/
End-to-End
https://learn.microsoft.com/en-us/training/modules/building-end-to-end-data-governance-master-data-stack-with-microsoft-purview-cluedin/ in 2 hr 38 min - Build an end to end data governance and master data management stack with Microsoft Purview and CluedIn
Security Copilot
Microsoft’s Security Copilot makes use of (Language Model Logics) to detect anomalies in logs.
- https://learn.microsoft.com/en-us/microsoft-365-copilot/microsoft-365-copilot-overview
- https://www.microsoft.com/en-us/security/business/ai-machine-learning/microsoft-security-copilot?rtc=1
- https://www.microsoft.com/en-us/security/blog/2023/11/08/insights-from-microsoft-security-copilot-early-adopters/
https://www.microsoft.com/en-us/security/blog/
https://www.microsoft.com/en-us/security/blog/2022/03/31/3-strategies-to-launch-an-effective-data-governance-plan/
Priva (Privacy)
https://learn.microsoft.com/en-us/privacy/priva/priva-overview
- European Union’s General Data Protection Regulation (GDPR)
- California Consumer Privacy Act (CCPA)
DAX Studio
Among https://www.sqlbi.com/tools/
DAX Studio is an open-sourced free IDE that provides an Object Browser, query editing and execution, formula and measure editing, syntax highlighting and formatting, integrated tracing, and query execution breakdowns to write, execute, and analyze DAX queries in Power BI Designer, Power Pivot for Excel, and Analysis Services Tabular.
Use Power BI Desktop to explore the Adventureworks database at https://daxstudio.org/docs/tutorials/writing-dax-queries/ using these sample commands:
The syntax of DAX Queries are described by Microsoft at https://learn.microsoft.com/en-us/dax/dax-queries
[DEFINE
    (
     (MEASURE table name[measure name] = scalar expression) |
     (VAR var name = table or scalar expression) |
     (TABLE table name = table expression) |
     (COLUMN table name[column name] = scalar expression) |
    ) +
]
(EVALUATE
    'Internet Sales'
ORDER BY
    'Internet Sales'[Sales Order Number]
START AT "SO7000") +
To return the calculated total sales for years 2013 and 2014, and combined calculated total sales for years 2013 and 2014, as a table. The measure in the DEFINE statement, Internet Total Sales, is used in both Total Sales and Combined Years Total Sales expressions.
DEFINE
    MEASURE 'Internet Sales'[Internet Total Sales] =
        SUM ( 'Internet Sales'[Sales Amount] )

EVALUATE
SUMMARIZECOLUMNS (
    'Date'[Calendar Year],
    TREATAS (
        {
            2013,
            2014
        },
        'Date'[Calendar Year]
    ),
    "Total Sales", [Internet Total Sales],
    "Combined Years Total Sales",
        CALCULATE (
            [Internet Total Sales],
            ALLSELECTED ( 'Date'[Calendar Year] )
        )
)
ORDER BY [Calendar Year]
References:
- https://hevodata.com/learn/dax-studio/
Reflex
Reflex rules are defined by Data Citizens and Data Analysts using the no-code GUI in Data Activator.
The Data Activator recognizes when a Reflex rule is triggered by events it monitors.
User Communities
https://www.reddit.com/r/MicrosoftFabric/comments/14iuplv/azure_data_factory_vs_data_pipelines/
-
Get a Microsoft Tech Community ID at https://techcommunity.microsoft.com
https://community.fabric.microsoft.com/
https://powerusers.microsoft.com/
Azure Data Community at https://www.microsoft.com/en-us/sql-server/community?activetab=pivot:sqlservertab has several sub-commmunity pages.
https://www.meetup.com/pro/azuretechgroups/ managed according to https://developer.microsoft.com/en-us/azure-tech-groups/
Azure Data Tech Groups at https://www.meetup.com/pro/azuredatatechgroups/ https://www.microsoft.com/en-us/sql-server/community?activetab=pivot:sqlservertab
https://passdatacommunitysummit.com (Nov 14-17 2023 Seattle)
Outside of Microsoft:
https://live360events.com/Events/Orlando-2023/Home.aspx
Resources
The Machine Learning done to train AI models within Microsoft Fabric uses AzureML on Synapse Spark component of Azure Synapse Analytics.
QUESTION: Microsoft Fabric is not built to work natively with OpenAI???
VIDEO:
Data Science with MLFlow (with demo):

https://www.linkedin.com/company/microsoftfabric/
More
This is one of a series about cloud computing:
- Dockerize apps
- Kubernetes container engine
- Hashicorp Vault and Consul for keeping secrets
- Hashicorp Terraform
- Ansible server configuration automation
- Serverless software app development
- Terraform (declarative IaC)
- Build load-balanced servers in AWS EC2
- AWS On-boarding (CLI install)
- AWS MacOS instances in the cloud)
- AWS Certifications
- AWS IAM admin.
- AWS Data Tools
- AWS Security
- AWS VPC Networking
- AWS X-Ray tracing
- AWS server deployment options
- AWS Lambda
- AWS Cloud Formation/cloud-formation/)
- AWS Lightsail
- AWS Deeplens AI
- AWS Load Balanced Servers using CloudFormation
-
Microtrader (sample microservices CI/CD to production Docker within AWS)
-
AWS Data Processing: Databases, Big Data, Data Warehouse, Data Lakehouse
- Google Cloud Platform
-
Bash Windows using Microsoft’s WSL (Windows Subsystem for Linux)
- Azure cloud introduction
- Azure Cloud Onramp (Subscriptions, Portal GUI, CLI)
- Azure Cloud Powershell
- PowerShell GitHub API programming
- PowerShell DSC (Desired State Configuration)
- PowerShell Modules
- Microsoft AI in Azure cloud
- Azure cloud DevOps
- Azure Networking
- Azure Storage
- Azure Compute
- Dynatrace cloud monitoring
- Digital Ocean
- Cloud Foundry
Se