

Visualize data using dashboards and paginated reports defined by DAX and Data Models on Azure Analytics Services. Pass Microsoft’s PL-300
![]()
![]()
![]()
![]()
![]()
![]()
![]()
![]()
![]()
![]()
![]()
![]()
![]()
Overview
- Power Platform Branding
- Competitors
- Power BI Components
- Features
- Showcase
- Workflows
- Pricing
- PL-300 certification
- GUI Building blocks
- Data Sources
- Free Desktop app in LEARN free
- app.powerbi.com SaaS account
- Power BI Services in the Azure cloud for Data Analytics
- Mobile app
- Power BI Desktop Windows App
- Power BI in Azure Virtual Machine
- Dashboard In a Day (DIAD)
- Data source settings
- Power Query
- Modeling
- Report Builder apps
- AI Builder in PowerBI
- DAX (Data Analysis eXpressions)
- DAX
- Data Analytics
- Dashboards
- Workspaces
- Other video tutorials on DA-100:
- Social Media around Power BI
- Capacities
- References
- Keywords for this article
- More on DevOps
- More about Azure
Here is a deep yet succinct hands-on step-by-step tutorial which is logically sequenced. NOTE: Content here are my personal opinions, and not intended to represent any employer (past or present). “PROTIP:” here highlight information I haven’t seen elsewhere on the internet because it is hard-won, little-know but significant facts based on my personal research and experience.
Wikipedia: Power BI was first released on July 24, 2015.
![]() The “BI” means “Business Intelligence” in Microsoft’s “Power BI” product name.
The “BI” means “Business Intelligence” in Microsoft’s “Power BI” product name.
Power BI is for displaying Analytics to discover intelligent insights within diverse data.
Power Platform Branding
![]() Power BI is grouped among other products in Microsoft’s “Power Platform” branding for software for consumers of data:
Power BI is grouped among other products in Microsoft’s “Power Platform” branding for software for consumers of data:
- Power Apps - Act: Build low-code solutions to business challenges.
- Power Automate - Streamline processes with no-code automation.
-
Power Assist - Handle routine inquiries at scale with conversational AI.
- Power SharePoint
- Power Financials
References:
Competitors
Gartner’s “Magic Quadrant” for Data Visualization products placed Microsoft at the prestigious top-right for over a decade:

Power BI is lower cost and more capabilities than its competitors in the data visualization market.
References:
- Tableau launched in 2003 (purchased by Salesforce June 10, 2019) $2000/user/year
- QlikView from Qlik
- Looker Studio
- Knowi supports native connectivity with NoSQL databases, do analytics directly on unstructured data NLP. search-based analytics in Slack.
- SAS
- Informatica
Power BI Components
The “Power BI” product brand name consists of several components:
Within a Azure Virtual Machine:
- Power BI Desktop Windows client program you install to run Flows in AI Builder.
-
Power BI Report Builder Windows client program
-
Power BI Services in the Azure cloud for Data Analytics display Power BI embedded using JavaScript (represented by the yellow “staircase” logo).
Create an Azure SaaS account for it. -
PowerBI” mobile app for iPhone and Android
- Connectors to data
PowerBI in various other Microsoft products:
- MS Teams (via Power app Dataverse),
- MS SharePoint,
- PowerPoint,
- Excel
NOTE: Microsoft Teams Personal Analytics
Gartner’s analysis RPA vendors in 2021 has Microsoft Power Automate leading all others in “strategy” but not in “execution”:

QUESTION: (Almost legacy) Data Tools running on-prem Window servers:
-
SSMS (SQL Server Management Studio) [W] provides an “Object Explorer” (based on Visual Studio 2017 Isolated Shell) for configuring, managing, and administering all components within Microsoft SQL Server. VIDEO. Installed with Azure Data Studio
-
SSIS (SQL Server Integration Services) is used to cleanse and mine data, copy & download files, load data warehouses, and manage SQL Server objects and data.
Features
Features of PowerBI are summarized in this matrix:
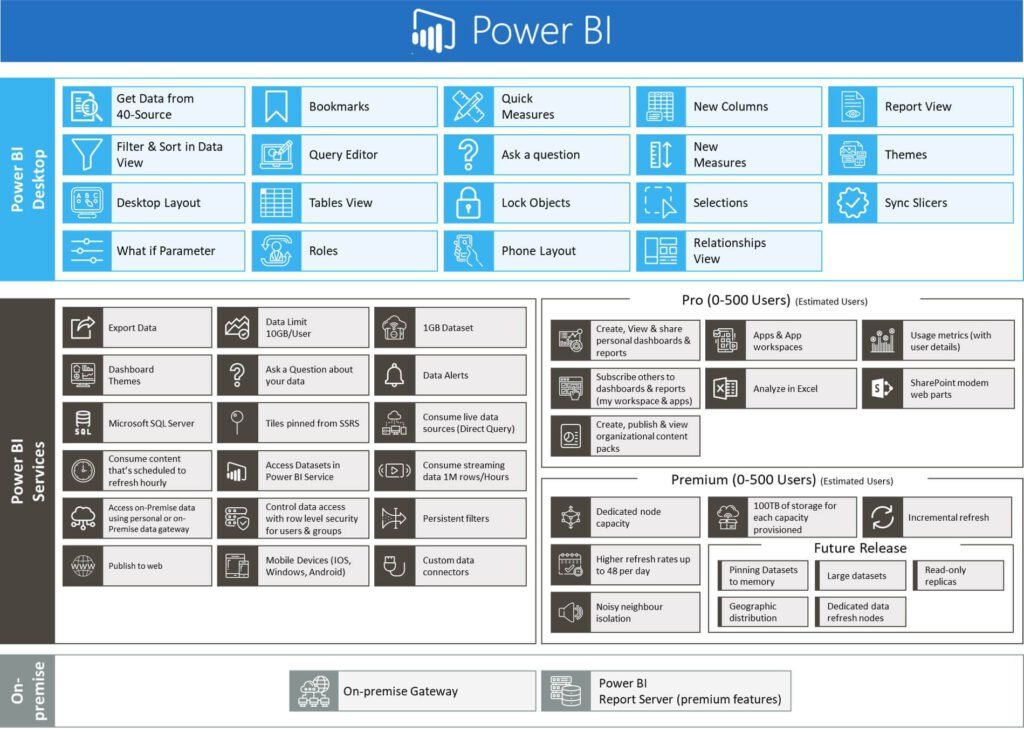 Click on image for full screen
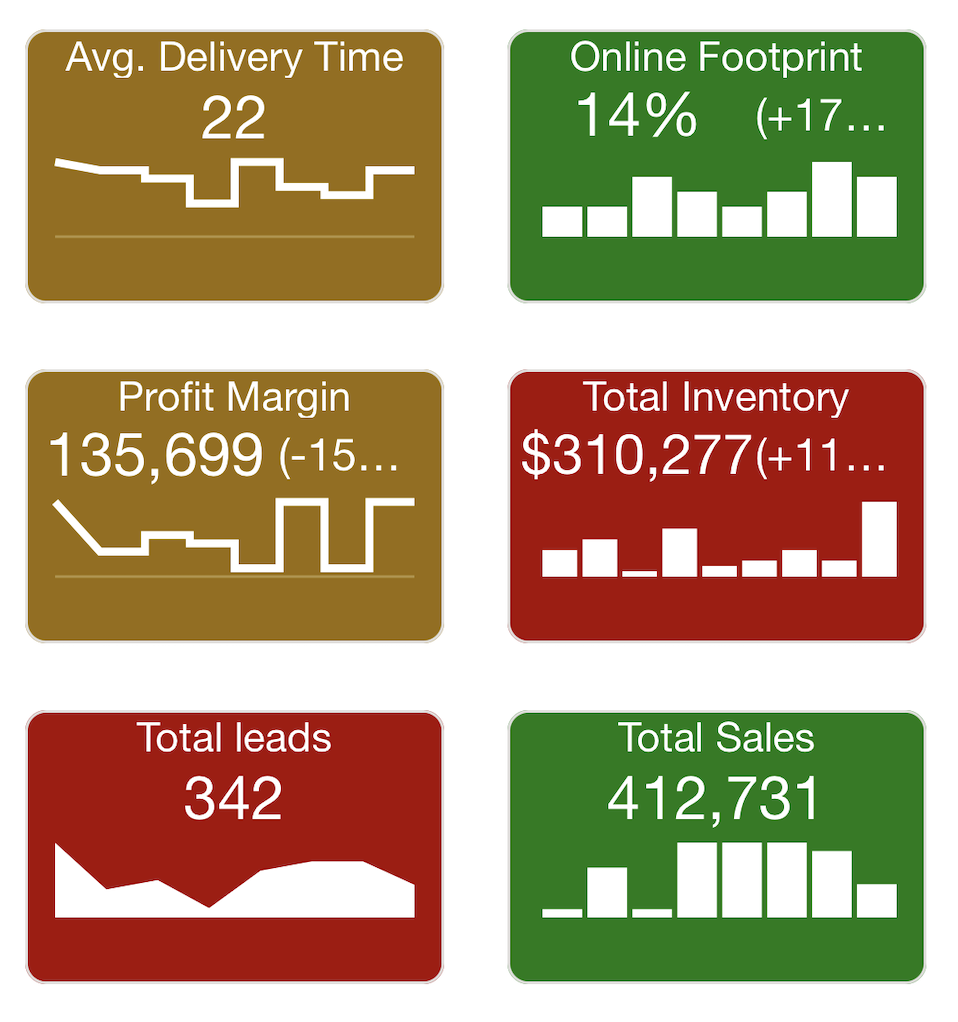
Showcase
The image at the top of this page present some examples of fancy dashboards created using Power BI:
VIDEO: World Population Health Analysis shows “Key Contributors” analysis
BI Elite Power BI Contest winners: 2020 2021
Microsoft sample databases on GitHub are for specific versions of SQL:
-
 AdventureWorksDW2020
Sample website: https://www.adventure-works.com/businesshttps://learn.microsoft.com/en-us/sql/samples/adventureworks-install-configure?view=sql-server-ver15&tabs=tsql#data-warehouse-downloads
https://github.com/microsoft/powerbi-desktop-samples/tree/main/DAX Adventure Works DW 2020.bak & .pbix
PROTIP: The difference betweeen Dimension and Fact tables in the star schema are optimized to segment and aggregate data about customers, people, products, and processes over several periods of time:
- FactCurrencyRate
- FactCallCenter
- FactInternetSales
- FactInternetSalesReason
- FactProductInventory
- FactResellerSales
- FactSalesQuota
-
FactFinance
- DimAccount
- DimCurrency
- DimCustomer
- DimDate
- DimDepartmentGroup
- DimEmployee
- DimGeography
- DimOrganization
- DimProduct
- DimProductCategory
- DimProductSubcategory
- DimPromotion
- DimReseller
- DimSalesReason
- DimSalesTerritory
-
DimScenario
- AdventureWorksDWBuildVersion
- sysdiagrams
There are also sample datasets from Kaggle competitions:
- New York Taxi trips
-
contoso-data-warehouse - to illustrate loading data into Azure SQL data warehouse.
-
wide-world-importers for SQL Server 2016 and Azure SQL Database. It illustrates the core capabilities of SQL Server 2016 and Azure SQL Database, for transaction processing (OLTP), data warehousing and analytics (OLAP) workloads, as well as hybrid transaction and analytics processing (HTAP) workloads.
-
northwind-pubs
VIDEO: Beautiful Dashboard from the VIDEO: Northwind database referencing this Odata .svc (XML) file containing collection definitions.
-
Tailwind Traders
Ways to analyze data:
-
A table with city and state, display a map
-
A table with start and end dates, calculate a duration
-
VIDEO: calculate work days</a>
Workflows
Nicolás Lagreste Zucchini in Madrids and Maria Florencia Hourcouripé in Madrid from analyticmood.com this in their Oreilly course provide :
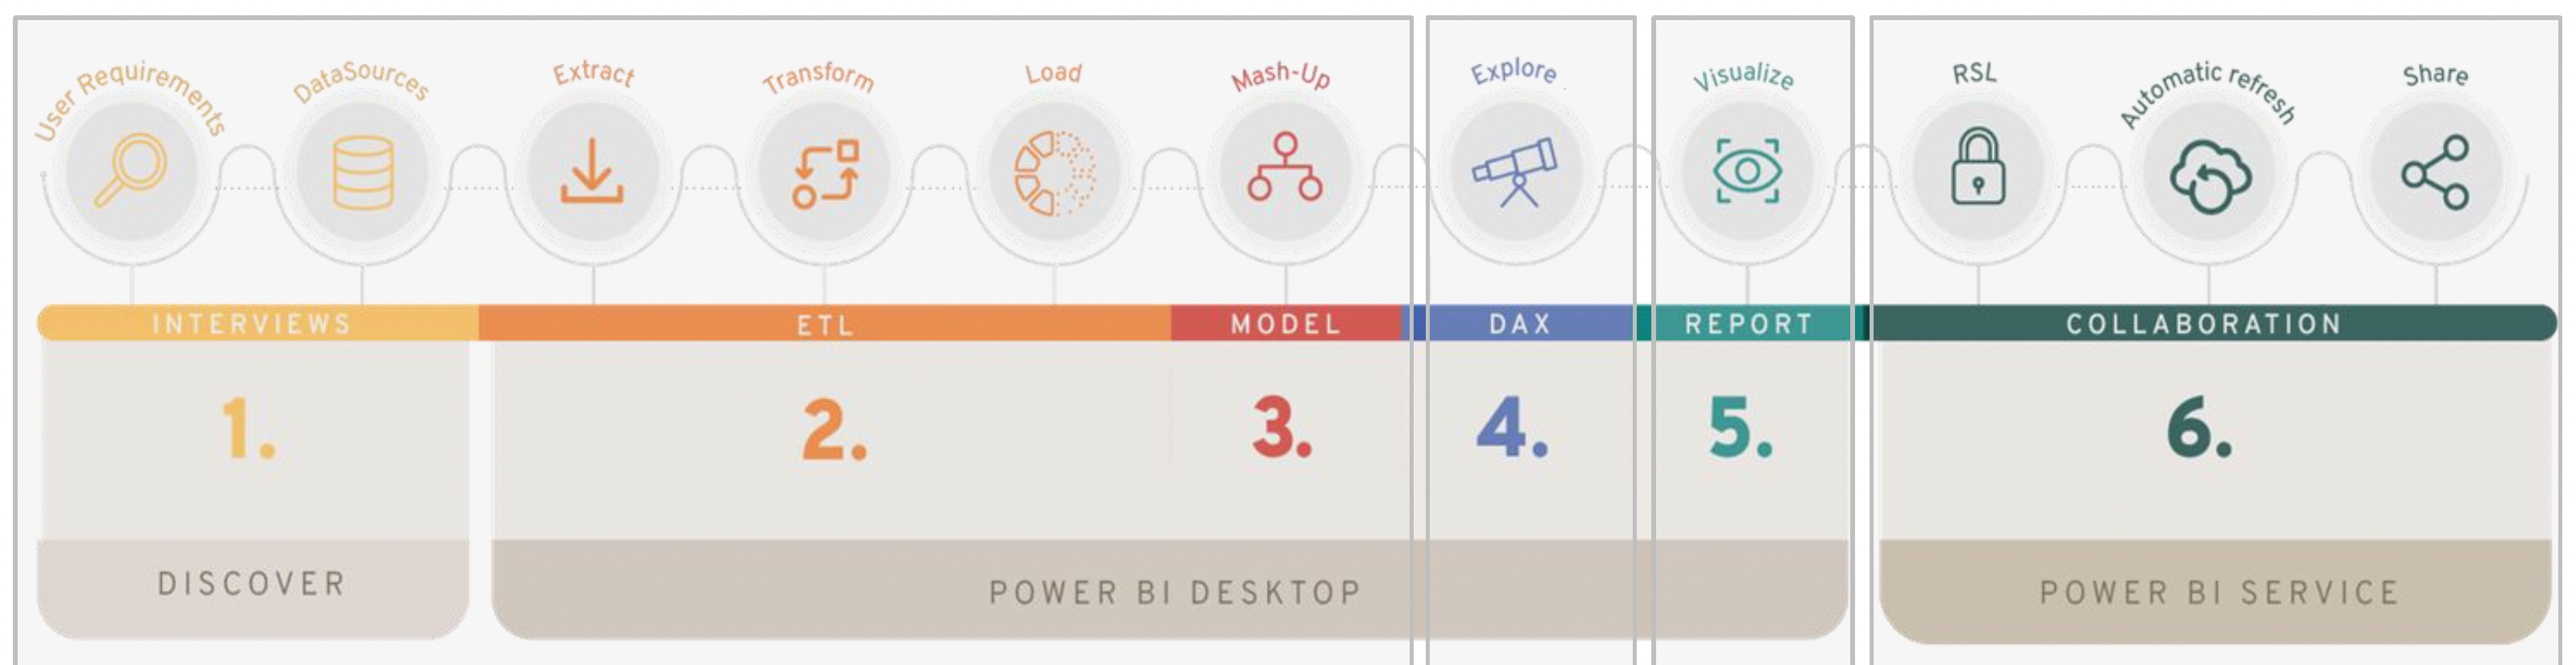
Author -> Publish -> Consume
Microsoft defines two types of users: Business users who interact with content created, then shared by designers.
The most common flow of activity:
- Bring data into Power BI Desktop and create a report (based on template?).
- Publish to the Power BI service, where you can create new visualizations or build dashboards.
- Share dashboards with others, especially people who are on the go.
- View and interact with shared dashboards and reports in Power BI Mobile apps.

2021 is Deployment Pipelines using GitHub and Azure DevOps for PowerBI.
REMEMBER: Land Use Planning on PowerBI desktop which is limited to 1280 pixels wide and 720 pixels high. Be proactive at dividing that real estate.
Pricing
DOCS: Levels of pricing (See comparison table):
-
Power BI Pro is included in Microsoft 365 E5, or $9.99/month by itself for up to 1 GB/model
-
Power BI Premium per user (PPU) $20/month/user of up to 100 GB/model
-
Power BI Premium $4,995/Per capacity/month for autoscale of up to 400 GB/model, on-prem. Power BI Report Server. That’s a yearly commitment billed monthly.
PROTIP: It may seem counter-intuitive, but self-service BI users are given “Pro” licenses and “occasional users” are assigned Premium licenses for viewing BI content.
| Total users | Pro Self-service | Occasional Premium Viewers |
|---|---|---|
| 200 | 50 | 150 |
| 700 | 100 | 600 |
| 5,000 | 4,000 | 1,000 |
Power BI Premium
Premium means:*
- Refresh of 48/day (vs. 8/day)
- Max. 100 TB (vs. 10 GB/user)
-
Unlimited data streaming (no 10K rows/hour limit)
-
Workspaces (assigned to a Premium Capacity)
- Deploy PowerBI content to multiple regions
- Gateway to On-prem. Power BI Report Server
- Store Power BI data to Azure Data Lake Storage Gens
- XMLA endpoint read/write connectivity
-
Dataflows (Direct Query, linked and computed entities, enhanced compute engine)
- Paginated reports written in RDL (Report Definition Language)
- Advanced AI (text analytics, image detection, automated machine learning) - AutoML & Azure ML
- Row-level security
- Content Pack
Premium “capacity” units
PROTIP: This is so complicated that it takes installing Microsoft’s PowerBI-Tools-For-Capacities app from GitHub.
With Gen 2, refreshes get spread out over a 24 hour period and don’t impact other queries from users. Gen2 adds autoscaling which instead of throttling, deals with spikes by calling on other vCores.
References:
- https://debbiesmspowerbiazureblog.home.blog/2021/01/21/power-bi-premium-generation-2-first-look/
- https://www.eyecademy.com/ultimate-power-bi-licensing-3/
- https://www.epcgroup.net/power-bi-cost/
- https://whitepages.unlimitedviz.com/2017/09/understanding-the-power-bi-capacity-based-skus/
- https://dynamics.folio3.com/blog/difference-between-power-bi-pro-vs-free-vs-premium/
PROTIP: To save money, consider PowerBI Robots which automatically takes screenshots of Microsoft Power BI dashboards and reports and sends them anywhere, to an unlimited number of recipients.
Capacity config
To use Power BI Premium Capacity, assign a workspace to a capacity.
To configure workloads:
-
in the Power BI admin portal

-
In Capacity settings > PREMIUM CAPACITIES, select a capacity size.
DOCS: Each capacity size selected specifies a static mix of machine v-cores, memory, and limits on peak render rate. Excess cores or memory or render quota each month you don’t use, you lose.
Size v-cores GB Mem Peak renders / hour Cost / Hour Cost / Month A1 1 3 300 ~$1 $720 A2 2 5 600 ~$2 $1,440 A3 4 10 1,200 ~$4 $2,880 A4 8 25 2,400 ~$8 $5,760 A5 16 50 4,800 ~$16 $11,520 A6 32 100 9,600 ~$32 $22,040 EM1 1 3 1-300 - $625 EM2 2 5 301-600 - $1,245 EM3 4 10 601-1,200 - $2,495 P1 8 25 2,400 - $4,995 P2 16 50 4,800 - $9,995 P3 32 100 9,600 - $19,995 “A” (Azure) SKU is “for testing and other scenarios” - a Platform-as-a-Service and set of APIs for those ISVs who are using Power BI as the data visualization layer of an application they develop. Power BI Embedded capacity is billed hourly, can be purchased hourly, and can be paused – meaning no long-term commitments to a specific capacity. This pausing capability is critical for small ISVs that don’t yet have the revenue stream to support monthly commitments.
While the capacity of the Power BI Embedded A1 SKU is equivalent to the Power BI Premium EM SKU, ISVs pay a slightly higher effective monthly price for the flexibility mentioned above.
“EM” (EM1-EM3) SKUs for content “EMbedding” of PBI Reports. Currently, this can be accomplished through the use of the SharePoint Power BI web part for modern pages, or through tabs in Microsoft Teams. Available only through volume licensing plans purchased through Microsoft Azure.. You can’t purchase them directly.
“P” (Premium) (P1-P3) SKUs vCores - embedding and enterprise features: Share Power Reports, dashboards and datasets through Power BI Apps (Workspaces), Ad hoc dashboard sharing from personal workspaces. Includes a license to install Power BI Report Server on-premises. But you’re getting a business application vs. a set of APIs.
- Under MORE OPTIONS, expand Workloads.
- Enable one or more workloads and set a value for Max Memory and other settings.
- Select Apply.
Capacity Planning
In order to identify the capacity to request, we need to calculate the capacity needed, based on projections from past usage trends.
How do we measure the speed and costs of requests to the star schema data?
PowerBI Desktop is a Windows exe. Can K6 control it?
Can we emulate the (SQL?) protocol Power BI uses to retrieve star data?
Capacity Monitoring
PROTIP: New Relic has dedicated capacities monitoring integration:
| Metric | Unit | Description |
|---|---|---|
| queryDurationMilliseconds | Milliseconds | DAX Query duration in last interval |
| queryPoolJobQueueLength | Count | Number of jobs in the queue of the query thread pool |
| qpuHighUtilizationMetric | Count | QPU High Utilization In Last Minute, 1 For High QPU Utilization, Otherwise 0 |
| memoryMetricBytes | Bytes | Memory. Range 0-3 GB for A1, 0-5 GB for A2, 0-10 GB for A3, 0-25 GB for A4, 0-50 GB for A5 and 0-100 GB for A6 |
| memoryThrashingMetricPercent | Percent | Average memory thrashing |
The number of vCores for each SKU is split between backend and front-end processing.
PL-300 certification
To become a “Microsoft Certified: Power BI Data Analyst Associate”, pay $165 to pass 70% in 120-minute exam PL-300 “Microsoft Power BI Data Analyst”: Question types include case studies, multi-select, drag-and-drop, build-list-reorder, and multiple-choice.
- LEARN: Get started
- LEARN: Prepare data [for analysis] (25-30%)
- LEARN: Model the data (25-30%)
- LEARN:Visualize and analyze the data (25-30%)
- LEARN: Manage workspaces: Deploy and maintain assets (15-20%)
From Pragmatic Works:
Preparing for the PL-300 Certification: Exam Overview by Angelica Domenech
PL-300 replaces the exam DA-100 “Analyzing Data with Microsoft Power BI” to become a “Microsoft Certified: Data Analyst Associate”.
- LEARN: Prepare data [for analysis] (20-25%)
- LEARN: Model the data (25-30%)
- LEARN:Visualize the data (20-25%)
- LEARN: Analyze the data (10-15%)
LEARN: Manage workspaces: Deploy and maintain deliverables (10-15%)
BOOK: DA-100 Exam Ref by Danììl Maslyuk
GUI Building blocks
The basic building blocks in Power BI:
-
Each app from the AppSource is a collection of ready-made visuals, pre-arranged in dashboards and reports.
- Visualizations – Visual representations of data, sometimes just called visuals
- Datasets – Collections of data that Power BI uses to create visualizations
-
Connectors to external datasets in various data formats
- Reports – Collections of visuals from a dataset, spanning one or more pages
-
Dashboards – Single-page collections of visuals built from reports
- The canvas is the area in the center of the Power BI service.
- Tiles within Dashboard
Data Sources
Common data sources like Microsoft Excel files, databases, or Microsoft Azure data, real-time Azure Synapse Analytics tables that combine with other databases and real-time sources to build a moment-by-moment dataset.
Power BI can software services (aka SaaS providers or cloud services): SAP, Salesforce, Facebook, Google Analytics, and more.
Connectors
Microsoft is working on connecting PowerBI to its many data repositories:
- CosmosDB
- PySpark DWH within Microsoft Fabric OneLake via VIDEO
- Dataverse Command Database (CMD) used by Dynamics CRM
- Microsoft Graph which holds all user’s calendars and activity history from all 365 apps.
Free Desktop app in LEARN free
PROTIP: You don’t need to setup an account or install an app while learning because Microsoft provides a virtual Power BI Desktop environment with LEARN labs.
REMEMBER: After 4 hours you start over with a blank instance.
-
Click a FREE LAB link (below)
-
Click “Launch Lab”, then “Start lab” to pop up a window (with no menu controls).
-
Optionally, to cast the screen to a TV, right-click anywhere on the screen and select “Cast…” and select a device.
-
Click the blue “Download Lab Files to D:\ Drive”.
github.com/MicrosoftLearning/PL-300-Microsoft-Power-BI-Data-Analyst contains labs used during Microsoft’s 3-day class to prepare students for the $165 PL-300 exam:
- Prepare the data
- Model the data
- Visualize and analyze the data
- Deploy and maintain assets
-
Open and configure Power BI Desktop. “LEARN” (above) contain labs which provide free time on a Power BI Desktop.
Microsoft FREE & Class Labs
Hands-on labs used during the 3-day Course PL-300T00: Microsoft Power BI Data Analyst class
-
01-prepare-data-with-power-query-in-power-bi-desktop/Solution
Using “Sales Analysis.pbix”:
Configure many-to-many relationships (so a salesperson’s sales, based on their assigned territories, are analyzed and compared with sales targets, using the SalespersonRegion bridging table with Cross Filter Both Direction.) To avoid the ambiguity of two possible filter propagation paths between the Salesperson and Sales tables being internally resolved based on a “least number of tables” assessment by Editing the Relationship to not active.
- Open Power BI Desktop
- Set Power BI Desktop options
- Connect to source data
- Preview source data
- Use data preview techniques to better understand the data (exploring and profiling the data in the Power Query Editor window) The Queries pane contains one query for each table checked. View Column Quality, Column distribution, Column profile.

-
02-load-data-with-power-query-in-power-bi-desktop
- Apply various transformations
-
Apply queries to load them to the data model
- Create model relationships
- Configure table and column properties
- Create hierarchies
- Create quick measures
-
04-create-dax-calculations-in-power-bi-desktop
Used in Power BI, Power Pivot, and SSAS Tabular for creating:
- Calculated Tables (new table derived from another table, such as a calendar) Recalculated when table pulled from is updated/refreshed. Unlike Power Query-sourced tables, calculated tables can’t be used to load data from external data sources. They can only transform data based on what has already been loaded into the data model.
- Calculated Columns (connecting disparate data sources with multiple key columns)
- Calculated Measures (Ratios/Percentages, needs a Dynamic Aggregator to work) Cannot be naked. Not calculated immediately.
I attended Microsoft’s 4-day live DA-100T00 class by Linda Larkin, but I highly recommend everyone to walk through the (free) lab instructions in English (and other languages) by Shannon Lindsay. The class Modules and labs aka.ms/da100labs
PROTIP: The numbering of Skillpipe modules and labs may not be exactly the same. So below I’ve combined links from the book, direct links to labs, and Microsoft’s 76 free “LEARNing paths”. “FREE LAB” (below) contain labs which provide free time on a virtual Power BI Desktop.
PROTIP: Many find that they need to go through each lab 2-3 times to gain “muscle memory” to know where to click in the GUI.
Module 1. Get Started with Microsoft Data Analytics
-
FREE LAB: Prepare Data in Power BI Desktop = LAB 01-prepare-data-with-power-query-in-power-bi-desktop.md 45 min.
Module 2. Get Data in Power BI = Prepare Data in Power BI
-
FREE LAB: Load Data in Power BI Desktop = LAB 02-load-data-with-power-query-in-power-bi-desktop.md
- Apply various transformations
- Apply queries to load them to the data model
Module 3. Clean, Transform, and Load Data in Power BI
-
FREE LAB: Model Data in Power BI Desktop, Part 1 = LAB 03-configure-data-model-in-power-bi-desktop.md
- Create model relationships
- Configure table and column properties
- Create hierarchies
- Create quick measures
Module 4. Design a Data Model in Power BI
- FREE LAB:
Model Data in Power BI Desktop, Part 2 = LAB 04-configure-data-model-in-power-bi-desktop-advanced.md
Using “Sales Analysis.pbix”:
- Configure many-to-many relationships (so a salesperson’s sales, based on their assigned territories, are analyzed and compared with sales targets, using the SalespersonRegion bridging table with Cross Filter Both Direction.) To avoid the ambiguity of two possible filter propagation paths between the Salesperson and Sales tables being internally resolved based on a “least number of tables” assessment by Editing the Relationship to not active.
- Configure many-to-many relationships (so a salesperson’s sales, based on their assigned territories, are analyzed and compared with sales targets, using the SalespersonRegion bridging table with Cross Filter Both Direction.) To avoid the ambiguity of two possible filter propagation paths between the Salesperson and Sales tables being internally resolved based on a “least number of tables” assessment by Editing the Relationship to not active.
app.powerbi.com SaaS account
You’ll need one eventually, so do it now.
-
PROTIP: Use Microsoft’s Edge browser here because that was used to test functionality for PowerBI. (Use another browser for documentation).
-
PROTIP: Click the avatar on your browser to select the profile associated with the email account you want to use.
PROTIP: PowerBI.com does not accept personal (gmail) accounts.
-
Get a PowerBI SaaS account associated with your work/organizational account at:
-
PROTIP: Add the above URL to your bookmarks for easy access in the future.
-
Sign in to the Power BI service on Azure:
See docs.microsoft.com/en-us/power-bi/consumer/end-user-sign-in
Display pbix files created in Power BI Desktop.
Power BI Services in the Azure cloud for Data Analytics
Mobile app
-
On your mobile’s Store, search for “Power BI” from “Microsoft Corporation”.
-
On your iPhone App Store app, click “Get” at
https://apps.apple.com/us/app/microsoft-power-bi/id929738808
On Android, click “Install” at
https://play.google.com/store/apps/details?id=com.microsoft.powerbim
-
Click “Get”

-
Samples provide data for several non-technical jobs:
- VP Sales
- Director of Operations
- Customer Care
- Director of Marketing
- CFO
- HR Manager
The Sample Retail Report KPIs:

The Sample Sales Report KPIs:
https://learn.microsoft.com/en-us/power-bi/collaborate-share/service-how-to-collaborate-distribute-dashboards-reports#annotate-and-share-from-the-power-bi-mobile-apps
Power BI Desktop Windows App
Microsoft has NOT created a PowerBI Desktop app for Apple MacOS. However, you can still run PowerBI for Windows on MacOS by using one of these options:
PROTIP: I bought a Windows laptop just so I can use PowerBI easily (and also use the NVIDIA GPU not on MacBooks). So others have installed PowerBI within Windows installed as a separate partition using Bootcamp, but they must reboot to switch. ___ works well but has been deprecated. PowerBI can also be installed within a Virtual Machine in the Azure or AWS cloud.
- Install Windows on MacOS using Boot Camp
-
Dual boot on MacOS
- https://app.turbo.net/run/powerbi/powerbi
- Install and run Power BI on a PC, then use a remote viewer to control that PC.
PROTIP: Click “Download” of PowerBI through the Windows Store. This enables automatic updates.
-
Microsoft’s Power BI product marketing home page:
-
Click on the “Products” at top, then “Power BI Desktop”.
https://learn.microsoft.com/en-us/power-bi/fundamentals/desktop-get-the-desktop
-
PROTIP: Click “Download” of PowerBI through the Windows Store. This enables automatic updates.
https://www.microsoft.com/en-us/download/details.aspx?id=58494
-
The default install path is:
C:\Program Files\Microsoft Power BI Desktop\
-
To view all options for installation, see:
powerbi.microsoft.com/en-us/downloads
Apps using Power BI can be launched from the Office 365 portal.
-
Microsoft’s marketing web page:
-
Testers usually prefer to download an .msi file to install so they can control when to manually update it periodically.
https://go.microsoft.com/fwlink/?LinkID=521662
Alternately, end-users typically prefer for the program to automatically update itself by installing from the Windows Store:
-
Dismiss the yellow “Getting started” pop-up of Social links (below).
-
The menu at left:

QUESTION: What are goals?
Power BI in Azure Virtual Machine
- Install and run Power BI on a Virtual Machine (on AWS), then remote in to that Virtual Machine. BLOG
- Power BI in Azure Virtual Machine
- Install and run Power BI on a Virtual Machine (on AWS), then remote in to that Virtual Machine. BLOG
-
Get an account. If you get free services, see:
https://www.geeksforgeeks.org/create-free-windows-virtual-machine-in-azure/
-
Download Bicep file based on this blog:
git clone https://github.com/wilsonmar/
az_win_vm.bicep
-
Edit the Bicep file
- Microsoft.SqlVirtualMachine
- Microsoft.Compute/virtualMachines
-
Microsoft.Compute/virtualMachines
- Microsoft.Network/networkinterfaces
- Microsoft.Network/networkSecurity…
- Microsoft.Network/publicIPAddresses
-
Select the Windows version
-
Login
az login
-
Edit the command to make the VM:
RUN_DATE=$(date '+%y%m%d')  # 241223 = yymmdd
ADMIN_USER="${USER}"
ADMIN_PASSWORD=$(openssl rand -base64 20)
az deployment group create \ --resource-group 'MyVMResourceGroup' \ --template-file az_win_vm.bicep \ --parameters virtualMachineName='testvm' \ existingVirtualNetworkName='MyVNET' \ existingVnetResourceGroup='MyVNET-rg' \ existingSubnetName='MySubnet' \ adminUsername="${ADMIN_USER}" adminPassword="${ADMIN_PASSWORD}" -
Confirm Resource Group check for security vulnerabilities
-
Start VM running.
https://www.phdata.io/blog/setting-up-powerbi-gateways-azure-virtual-machines/
-
Press the Connect drop-down and select RDP and then click Download RDP File.
-
Within VM,Install Power BI Desktop
-
Download file into Desktop
-
Setup Power BI Gateway to share
- Open an internet browser to https://app.PowerBI.com
-
Login using your organizational email and password to see:
https://app.powerbi.com/home?experience=power-bi
-
PROTIP: Save this
-
Click on the download icon and select Data Gateway.
-
View dashboards and reports.
-
View in Power BI Mobile app
- In Terminal, destroy resource group
Other DA-100 Video Tutorials
Helen Wall has several courses on LinkedIn Learning:
- https://www.linkedin.com/learning/power-bi-essential-training-3/create-rich-interactive-reports-with-power-bi
- https://www.linkedin.com/learning/advanced-microsoft-power-bi/reducing-data-headaches
Pluralsight’s courses on PowerBI features Stacia Misner Varga and others.
CloudAcademy.com
Dashboard In a Day (DIAD)
Microsoft’s “Dashboard In a Day” (DIAD) are one-day, hands-on virtual workshops to expose business analysts to Power BI.
-
Download the zip file
DashboardinaDayAssets.zip
-
Unzip it (to 454.6 MB). CAUTION: I tried to put the zip into a github repo, but got blocked by this error:
remote: error: GH001: Large files detected. You may want to try Git Large File Storage - https://git-lfs.github.com. remote: error: See http://git.io/iEPt8g for more information.

remote: error: File Data/USSales/sales.csv is 141.49 MB; this exceeds GitHub's file size limit of 100.00 MB
To github.com:wilsonmar/powerbi-diad.git
- In Finder, expand (for folders A4, Data, Letter, Reports).
-
If you’re in the US, delete the A4 folder containing pdf files formatted for European printers. If you’re in Europe, delete the “Letter” folder. They both contain:
- Lab 0 - Prerequisites and Document Structure.pdf
- Lab 1 - Accessing and Preparing Data.pdf
- Lab 2 - Data Modeling and Exploration.pdf
- Lab 3 - Data Visualization.pdf
- Lab 4 - Publishing and Accessing Reports.pdf
- Lab 5 - Collaboration.pdf
The Reports folder contains Solution pbix files.
BlueGranite.com recorded (in 2020)how to do each in a YouTube videos, listed by date here:
- Intro
- Lab Prerequisites [2020]
- Accessing Data [2020 Lab 1 Part 1]

- Preparing Data [2020 Lab 1 Part 2]
- Data Modeling [2020 Lab 2 Part 1]
- 02 Accessing Data [Feb 2020]
- 03 Data Prep [Feb 2020]
- 04 Data Modeling & Exploration Part A [Feb 2020]
- 05 Data Modeling & Exploration Part B [Feb 2020]
- 06 Data Modeling & Exploration Part C [Feb 2020]
- DIAD [Mar 2021]
- DIAD [Apr 2021]
- DIAD [Jun 2021]
VIDEO: AltisConsulting (UK) on Oct 1, 2020 promote their DIAD delivery.
Data source settings
-
In the Home ribbon:

-
Click a data source among the icons or
click “Get Data” drop down.- Excel
- Power BI datasets (.pbix file extension)
- Power BI dataflows
- Microsoft SQL Server (relational): AdventureWorksDW2020 or TailspinToys2020-US
- Analysis Services
- Text/CSV
- Web
- OData feed
- Black query More: Azure:
- Azure Cosmos DB (NoSQL database)
- Finance Azure Analysis Server Cubes (Azure Analysis Services)
- (online services)
PROTIP: For security reasons, imports of local copies of data into reports are not allowed. So use DirectQuery storage mode.
Data locations:
- Local
- OneDrive cloud - Business
- OneDrive cloud - Personal
- SharePoint Team Sites cloud
Load CSV from GitHub
PROTIP: This is a good demo of using Text Paste
-
To load a file from GitHub, click Raw, then highlight and copy the URL, such as:
-
Switch to Power BI Desktop.
-
In Home, click “Get Data”, “Text/CSV”, “Web”, yellow “Connect”.
-
With “Basic” selected, click in the URL field to paste into.
-
If you’re within a LEARN window, click the blue lightning bolt at the upper-left corner to select “Type Text”, “Type Clipboard Text”, and paste this and click OK:

-
With “Basic” selected, click in the URL field to paste:
-
In “Access Web Content”, pull down “Select which level to apply these settings to” and select the lowest item.
-
Click yellow Connect.
STATUS: I’m getting an error here. Working on it.
The default import hard-codes column names. VIDEO:
Load OData Northwind
- Get Data
- OData feed
- In URL: https://services.odata.org/Northwind/Northwind.svc
- OK for Navigator.
- Select tables.
Power Query
Power Query is the query engine used by Power BI and Excel.
The “Power Query M formula language is optimized for building highly flexible data mashup queries. It’s a functional, case sensitive language similar to F#” – powerquery.io.
- Click the “Transform” button to open the Query Editor.
https://docs.microsoft.com/en-us/learn/modules/clean-data-power-bi/
Modeling

Manage Relationships
Report Builder apps
REMEMBER: There are TWO “Report Builder” apps:
- “Microsoft Power BUI Report Builder” and
- “Microsoft Report Builder”
Microsoft Power BI Report Builder app
- https://docs.microsoft.com/power-bi/report-builder-power-bi
- https://learn.microsoft.com/en-us/power-bi/paginated-reports/report-builder-power-bi
- https://apps.microsoft.com/detail/9n3bl69hc2mc?hl=en-US&gl=US
- https://www.phdata.io/blog/what-is-power-bi-report-builder/
As of this writing on March 21, 2024, the latest installer for English is 78.7 MB on 7/17/2023 – the PowerBiReportBuilder.msi only works on Windows machines (not macOS & Linux).
Power BI Report Builder is optimized for authoring paginated reports for the Power BI service. This download provides a stand-alone installer for Power BI Report Builder. It provides data visualizations that include charts, maps, sparklines, and data bars that can help produce new insights well beyond what can be achieved with standard tables and charts.
VIDEO PROTIP: Report Builder is replaced on the SaaS PowerBI OneLake data hub. It’s available from the main search as “Create paginated report” drop-down and in context menus.
Microsoft Report Builder
Microsoft Report Builder provides a productive report-authoring environment for IT professionals and power users. Report Builder provides data visualizations that include charts, maps, sparklines, and data bars that can help produce new insights well beyond what can be achieved with standard tables and charts. Use Report Builder to create reports and shared datasets. Publish report parts, and then browse the Report Part Gallery to reuse existing report parts as building blocks for creating new reports quickly with a “grab and go” experience.”
https://learn.microsoft.com/en-us/sql/reporting-services/install-windows/install-report-builder?view=sql-server-ver16
As of this writing on March 21, 2024, the latest installer for English is 24.6 MB on 5/31/2023 – the ReportBuilder.msi only works on Windows machines (not macOS & Linux).
AI Builder in PowerBI
https://docs.microsoft.com/en-us/ai-builder/flow-text-translation
-
Sign in to Power Automate (https://us.flow.microsoft.com/en-us/)
-
Select My flows in the left pane, and then select New flow > Instant cloud flow.
-
Name your flow, select Manually trigger a flow under Choose how to trigger this flow, and then select Create.
-
Expand Manually trigger a flow, and then select +Add an input > Text as the input type.
-
Replace Input with My Text (also known as the title).
-
Select + New step > AI Builder.
-
Select Translate text into another language in the list of actions.
-
Select My Text from the Dynamic content list.
-
Select the target language in the Translate to input.
-
The model will automatically detect the source language for you. But optionally, you can select a source language in the Translate from input to specify the language of the text in My Text input.
-
In successive actions, you can use any columns extracted by the AI Builder model, such as “Send me an email” notification of the translated text with property Text from the text translation model.
-
Run in Azure DevOps pipeline:
https://community.powerbi.com/t5/Community-Blog/PowerBI-CICD-using-Azure-DevOps/ba-p/769244
DAX (Data Analysis eXpressions)
DAX = Data Analysis eXpressions (formula-based language) is like Excel functions (such as AVERAGE), operators, and constants used in formulas to calculate or return one or more values.
DOCS:
DAX Queries are used in Power BI analysis services and DAX Studio.
DAX Formulas are used in Power BI and Power Pivot.
VIDEO: VIDEO: DAX Formular sample syntax with “=” operator:
- measure=FUNCTION(table[column])
DAX
Module 5 Create Model Calculations using DAX in Power BI
-
FREE LAB: Create DAX Calculations in Power BI Desktop, Part 1 = 05-create-dax-calculations-in-power-bi-desktop.md
-
FREE LAB: Create DAX Calculations in Power BI Desktop, Part 2 = LAB 06-create-dax-calculations-in-power-bi-desktop-advanced.md
Datacamp has a cheat sheet: PDF: Maths & Statistical Functions
Notice the “X” functions:
- SUM(column) Adds all the numbers in a column.
- SUMX(table, expression) Returns the sum of an expression evaluated for each row in a table.
- AVERAGE(column) Returns the average (arithmetic mean) of all the numbers in a column.
- AVERAGEX(table, expression) Calculates the average (arithmetic mean) of a set of expressions evaluated over a table.
- MEDIAN(column) Returns the median of a column.
- MEDIANX(table, expression) Calculates the median of a set of expressions evaluated over a table.
- GEOMEAN(column) Calculates the geometric mean of a column.
- GEOMEANX(table, expression) Calculates the geometric mean of a set of expressions evaluated over a table.
- COUNT(column) Returns the number of cells in a column that contains non-blank values.
- COUNTX(table, expression) Counts the number of rows from an expression that evaluates to a non-blank value.
- DIVIDE(numerator, denominator [,alternateresult]) Performs division and returns alternate result or BLANK() on division by 0.
- MIN(column) Returns a minimum value of a column.
- MAX(column) Returns a maximum value of a column.
- COUNTROWS([table]) Counts the number of rows in a table.
- DISTINCTCOUNT(column) Counts the number of distinct values in a column.
- RANKX(table, expression[, value[, order[, ties]]]) Returns the ranking of a number in a list of numbers for each row in the table argument.
Filter Functions:
- FILTER(table, filter) Returns a table that is a subset of another table or expression.
- CALCULATE(expression[, filter1 [, filter2 [, …]]]) Evaluates an expression in a filter context.
- HASONEVALUE(columnName) Returns TRUE when the context for columnName has been filtered down to one distinct value only. Otherwise, it is FALSE.
- ALLNOBLANKROW(table | column[, column[, column[,…]]]) Returns a table that is a subset of another table or expression.
- ALL([table | column[, column[, column[,…]]]]) Returns all the rows in a table, or all the values in a column, ignoring any filters that might have been applied.
- ALLEXCEPT(table, column[, column[,..]]) Returns all the rows in a table except for those rows that are affected by the specified column filters.
- REMOVEFILTERS([table | column][, column[, column[,…]]]]) Clear all filters from designated tables or columns.
Logical Functions
- IF(logical_test, value_if_true[, value_if_false]) Checks a condition, and returns a certain value depending on whether it is true or false.
- AND(logical 1, logical 2) Checks whether both arguments are TRUE, and returns TRUE if both arguments are TRUE. Otherwise, it returns FALSE.
- OR(logical 1, logical 2) Checks whether one of the arguments is TRUE to return TRUE. The function returns FALSE if both arguments are FALSE.
- NOT(logical) Changes TRUE to FALSE and vice versa.
- SWITCH(expression, value, result[, value, result]…[, else]) Evaluates an expression against a list of values and returns one of possible results
- IFERROR(value, value_if_error) Returns value_if_error if the first expression is an error and the value of the expression itself otherwise.
Date & Time Functions
- CALENDAR(start_date, end_date) Returns a table with a single column named “Date” that contains a contiguous set of dates.
- DATE(year, month, day) Returns the specified date in datetime format.
- DATEDIFF(date_1, date_2, interval) Returns the number of units between two dates as defined in interval.
- DATEVALUE(date_text) Converts a date in text to a date in datetime format.
- DAY(date) Returns a number from 1 to 31 representing the day of the month.
- WEEKNUM(date) Returns weeknumber in the year.
- MONTH(date) Returns a number from 1 to 12 representing a month.
- QUARTER(date) Returns a number from 1 to 4 representing a quarter.
Time Intelligence Functions
- DATEADD(dates, number_of_intervals, interval) Moves a date by a specific interval.
- DATESBETWEEN(dates, date_1, date_2) Returns the dates between specified dates.
- TOTALYTD(expression, dates[, filter][, year_end_date]) Evaluates the year-to-date value of the expression in the current context.
- SAMEPERIODLASTYEAR(dates) Returns a table that contains a column of dates shifted one year back in time.
- STARTOFMONTH(dates) // ENDOFMONTH(dates) Returns the start // end of the month.
- STARTOFQUARTER(dates) // ENDOFQUARTER(dates) Returns the start // end of the quarter.
- STARTOFYEAR(dates) // ENDOFYEAR(dates) Returns the start // end of the quarter. Relationship Functions
- CROSSFILTER(left_column, right_column, crossfiltertype) Specifies the cross-filtering direction to be used in a calculation.
- RELATED(column) Returns a related value from another table.
Table Manipulation Functions
- SUMMARIZE(table, groupBy_columnName[, groupBy_columnName]…[, name, expression]…) Returns a summary table for the requested totals over a set of groups.
- DISTINCT(table) Returns a table by removing duplicate rows from another table or expression.
- ADDCOLUMNS(table, name, expression[, name, expression]…) Adds calculated columns to the given table or table expression.
- SELECTCOLUMNS(table, name, expression[, name, expression]…) Selects calculated columns from the given table or table expression.
- GROUPBY(table [, groupBy_columnName[, [column_name] [expression]]…) Create a summary of the input table grouped by specific columns.
- INTERSECT(left_table, right_table) Returns the rows of the left-side table that appear in the right-side table.
- NATURALINNERJOIN(left_table, right_table) Joins two tables using an inner join.
- NATURALLEFTOUTERJOIN(left_table, right_table) Joins two tables using a left outer join.
- UNION(table, table[, table [,…]]) Returns the union of tables with matching columns.
Text Functions
- EXACT(text_1, text_2) Checks if two strings are identical (EXACT() is case sensitive).
- FIND(text_tofind, in_text) Returns the starting position a text within another text (FIND() is case sensitive).
- FORMAT(value, format) Converts a value to a text in the specified number format.
- LEFT(text, num_chars) Returns the number of characters from the start of a string.
- RIGHT(text, num_chars) Returns the number of characters from the end of a string.
- LEN(text) Returns the number of characters in a string of text.
- LOWER(text) Converts all letters in a string to lowercase.
- UPPER(text) Converts all letters in a string to uppercase.
- TRIM(text) Remove all spaces from a text string.
- CONCATENATE(text_1, text_2) Joins two strings together into one string.
- SUBSTITUTE(text, old_text, new_text, instance_num) Replaces existing text with new text in a string.
- REPLACE(old_text, start_posotion, num_chars, new_text) Replaces part of a string with a new string.
Information Functions
- COLUMNSTATISTICS() Returns statistics regarding every column in every table. This function has no arguments.
- NAMEOF(value) Returns the column or measure name of a value.
- ISBLANK(value) // ISERROR(value) Returns whether the value is blank // an error.
- ISLOGICAL(value) Checks whether a value is logical or not.
- ISNUMBER(value) Checks whether a value is a number or not.
- ISFILTERED(table | column) Returns true when there are direct filters on a column.
- ISCROSSFILTERED(table | column) Returns true when there are crossfilters on a column.
- USERPRINCIPALNAME() Returns the user principal name or email address. This function has no arguments.
DAX Statements
- VAR(name = expression) Stores the result of an expression as a named variable. To return the variable, use RETURN after the variable is defined.
- COLUMN(table[column] = expression) Stores the result of an expression as a column in a table.
- ORDER BY(table[column]) Defines the sort order of a column. Every column can be sorted in ascending (ASC) or descending (DESC) way.
DAX Operators
Comparison operators Meaning:
- = Equal to
- = = Strict equal to
- > Great than
- < Smaller than
- > = Greater than or equal to
- = < Smaller than or equal to
- < > Not equal to
| Logical operator | Meaning | Example |
|---|---|---|
| && | AND condition | ([City] = "Bru") && ([Return] = "Yes")) |
| | | | OR condition | ([City] = "Bru") | | ([Return] = "Yes")) |
| IN {} | OR condition for each row | Product[Color] IN {"Red", "Blue", "Gold"} |
Module 7 Create Reports
-
FREE LAB: Design a Report in Power BI Desktop, Part 1 = LAB 07-design-report-in-power-bi-desktop.md
- Design a report
- Configure visual fields and format properties
-
FREE LAB: Design a Report in Power BI Desktop, Part 2 = LAB 08-design-report-in-power-bi-desktop-enhanced.md
- Sync slicers
- Create a drillthrough page
- Apply conditional formatting
- Create and use bookmarks
Module 8 Create Dashboards
-
FREE LAB: Create a Power BI Dashboard = LAB 09-create-power-bi-dashboard.md
- Pin visuals to a dashboard
- Use Q&A to create dashboard tiles
- Configure a dashboard tile alert
Module 9 Create Paginated Reports in Power BI
-
FREE LAB: Perform Data Analysis in Power BI Desktop = LAB 11-perform-data-analysis-in-power-bi-desktop.md
- Create animated scatter charts
- Use a visual to forecast values
- Work with the decomposition tree visual
- Work with the key influencers visual
Module 10 Perform Advanced Analytics
-
FREE LAB: Create a Power BI Paginated Report = LAB 10-create-power-bi-paginated-report.md
NOTE: Paginated (RDL) reports require a Premium license.
- Use Power BI Report Builder
- Design a multi-page report layout
- Define a data source
- Define a dataset
- Create a report parameter
-
Export a report to PDF
- Download Power BI Report Builder
- LEARN: Power BI Paginated Reports in a Day course
-
https://www.phdata.io/blog/what-is-power-bi-report-builder/
- VIDEO: @HatFullOfData123 by Lauren Graham</a>
- cfinlan
Module 11 Create and Manage Workspaces
Module 12 Manage Datasets in Power BI
Module 13 Row-level Security
DAX Functions
Each function references a complete column or table.
A function can return a table.
# Sales All Region measure definition
Sales All Region =
CALCULATE(SUM(Sales[Sales]), REMOVEFILTERS(Region))
# Sales % All Region measure definition (replace Sales All Region measure)
Sales % All Region =
DIVIDE(
   SUM(Sales[Sales]),
   CALCULATE(
      SUM(Sales[Sales]),
      REMOVEFILTERS(Region)
   )
)
# Sales % Country measure definition
Sales % Country =
DIVIDE(
   SUM(Sales[Sales]),
   CALCULATE(
      SUM(Sales[Sales]),
      REMOVEFILTERS(Region[Region])
   )
)
# Sales % Country measure definition (2)
Sales % Country =
IF(
   ISINSCOPE(Region[Region]),
   DIVIDE(
      SUM(Sales[Sales]),
      CALCULATE(
         SUM(Sales[Sales]),
         REMOVEFILTERS(Region[Region])
      )
   )
)
# Sales % Group measure definition
Sales % Group =
DIVIDE(
   SUM(Sales[Sales]),
   CALCULATE(
      SUM(Sales[Sales]),
      REMOVEFILTERS(
         Region[Region],
         Region[Country]
      )
   )
)
# Sales % Group measure definition (2)
Sales % Group =
IF(
   ISINSCOPE(Region[Region])
     |  | ISINSCOPE(Region[Country]),
   DIVIDE(
      SUM(Sales[Sales]),
      CALCULATE(
         SUM(Sales[Sales]),
         REMOVEFILTERS(
            Region[Region],
            Region[Country]
         )
      )
   )
)
# Sales table: Sales YTD measure definition
Sales YTD =
TOTALYTD(SUM(Sales[Sales]), 'Date'[Date], "6-30")
# Sales table: Sales YoY Growth
Sales YoY Growth =
VAR SalesPriorYear =
   CALCULATE(
      SUM(Sales[Sales]),
      PARALLELPERIOD(
         'Date'[Date],
         -12,
         MONTH
      )
   )
RETURN
   SalesPriorYear
# Sales table: Sales YoY Growth (2)
Sales YoY Growth =
VAR SalesPriorYear =
   CALCULATE(
      SUM(Sales[Sales]),
      PARALLELPERIOD(
         'Date'[Date],
         -12,
         MONTH
      )
   )
RETURN
   DIVIDE(
      (SUM(Sales[Sales]) - SalesPriorYear),
      SalesPriorYear
   )
Data Analytics
Core components of analytics are divided into the following categories:
-
Descriptive - what has happened based on historical data. Key Performance Indicators (KPIs) such as return on investment (ROI) track performance toward key objectives.
-
Diagnostic - answers why events happened. discover the cause of these events. why these events improved or became worse. Identify anomalies
-
Predictive - answers questions about what will happen in the future. identify trends
-
Prescriptive - answer questions about which actions should be taken to achieve a goal or target. patterns in large datasets.
-
Cognitive help you learn what might happen if circumstances change, to determine how to handle these situations.
Roles and tasks:
- Business analyst
- Data analyst - Tasks: Prepare, Analyze, Model, Manage, Visualize
- Data engineer
- Data scientist
- Database administrator
Dashboards
Each dashboard contains several views.
Workspaces
Workspaces are better for collaboration than My Workspace, because they allow co-ownership of content.
https://learn.microsoft.com/en-us/power-bi/collaborate-share/service-how-to-collaborate-distribute-dashboards-reports#collaborate-in-a-workspace
- a different workspace for different audiences (Sales, HR, etc.)
- different environments (DEV, TEST, PROD)
- to split the load: hosted in a separate workspace a report with a very high consumption rate kept separate from other reports with low rate of consumption.
References: https://radacad.com/how-to-organize-workspaces-in-a-power-bi-environment
Desktop config
-
To open Power BI Desktop,
click the yellow Power BI icon at the bottom of the screen. -
To dismiss the yellow “Getting Started” pop-up,
click the upper-right corner of the pop-up.NOTE: You can get that pop-up again by clicking “Getting started” in the File menu.
-
Click “File” on the top menu.

-
Click “Options and Settings”, “Options”.
-
Under menu category CURRENT FILE:, Data Load:

Other video tutorials on DA-100:
Social Media around Power BI
-
Microsoft’s YouTube channel is where @JustynaLucznik (Principal Program Manger) show videos.
-
powerbi.microsoft.com/en-us/blog by Microsoft Program Managers
-
community.powerbi.com Fabric forums managed by Microsoft
DA-100 Practice exams
Capacities
This AVM module deploys a Power BI Dedicated Capacity:
https://github.com/Azure/bicep-registry-modules/tree/main/avm/res/power-bi-dedicated/capacity The README differentiates 3 example ways: via Bicep module via JSON Parameter file
-
Example 1: Using only defaults
This instance deploys the module with the minimum set of required parameters.
-
Example 2: Using large parameter set
This instance deploys the module with most of its features enabled.
-
Example 3: WAF-aligned
This instance deploys the module in alignment with the best-practices of the Well-Architected Framework.
References
https://learn.microsoft.com/en-us/training/paths/work-semantic-models-microsoft-fabric/
- Understand Scalability in Power BI
- Create Power BI model relationships
- Use tools to optimize Power BI performance
- Enforce Power BI model security
On Udemy:
Santosh Pothnak from in Hyderabad, India (santoshpothnak.com) has classes on Udemy about PowerBI on his YouTube channel.
On OReilly.com:
14h 35m Microsoft Power BI - The Complete Masterclass [2023 EDITION] from Packt by Nikolai Schuler from Bulgaria
On LinkedIn: Power BI Learning courses
https://medium.com/att-israel/finally-automation-testing-for-power-bi-4cbda6f81c26 Finally, Automation Testing for Power BI
https://www.youtube.com/watch?v=GHqYY_UPtVk Top 3 Underutilized Power BI Visuals (Sparklines, Metrics)
Keywords for this article
#PowerBIDesktop #FolderConnector #CSVFiles #DataAnalysis #BusinessIntelligence #BulkDataImport #DataVisualization #PowerBITutorial #DataIntegration #BusinessAnalytics
https://medium.com/search?q=powerbi+performance
More on DevOps
This is one of a series on DevOps:
- DevOps_2.0
- ci-cd (Continuous Integration and Continuous Delivery)
- User Stories for DevOps
- Git and GitHub vs File Archival
- Git Commands and Statuses
- Git Commit, Tag, Push
- Git Utilities
- Data Security GitHub
- GitHub API
- Choices for DevOps Technologies
- Pulumi Infrastructure as Code (IaC)
- Java DevOps Workflow
- AWS DevOps (CodeCommit, CodePipeline, CodeDeploy)
- AWS server deployment options
- Cloud services comparisons (across vendors)
- Cloud regions (across vendors)
- Azure Cloud Onramp (Subscriptions, Portal GUI, CLI)
- Azure Certifications
- Azure Cloud Powershell
- Bash Windows using Microsoft’s WSL (Windows Subsystem for Linux)
- Azure Networking
- Azure Storage
- Azure Compute
- Digital Ocean
- Packer automation to build Vagrant images
- Terraform multi-cloud provisioning automation
-
Hashicorp Vault and Consul to generate and hold secrets
- Powershell Ecosystem
- Powershell on MacOS
- Jenkins Server Setup
- Jenkins Plug-ins
- Jenkins Freestyle jobs
- Docker (Glossary, Ecosystem, Certification)
- Make Makefile for Docker
- Docker Setup and run Bash shell script
- Bash coding
- Docker Setup
- Dockerize apps
- Ansible
- Kubernetes Operators
- Threat Modeling
- API Management Microsoft
- Scenarios for load
- Chaos Engineering
More about Azure
This is one of a series about Azure cloud:
- Azure cloud introduction
- Azure Cloud Onramp (Subscriptions, Portal GUI, CLI)
- RDP client to access servers
- Bash Windows using Microsoft’s WSL (Windows Subsystem for Linux)
- Microsoft PowerShell ecosystem
- Azure Cloud Powershell
- PowerShell DSC (Desired State Configuration)
- PowerShell Modules
- Azure Networking
- Azure Storage
- Azure Compute
- Azure cloud DevOps
- Dockerize apps
- Kubernetes container engine
- Hashicorp Vault and Consul for keeping secrets
- Hashicorp Terraform
- Ansible
- Microsoft AI in Azure cloud
- Azure Monitoring
- Azure KSQL (Kusto Query Language) for Azure Monitor, etc.
- Dynatrace cloud monitoring
- Cloud Performance testing/engineering
- Cloud JMeter